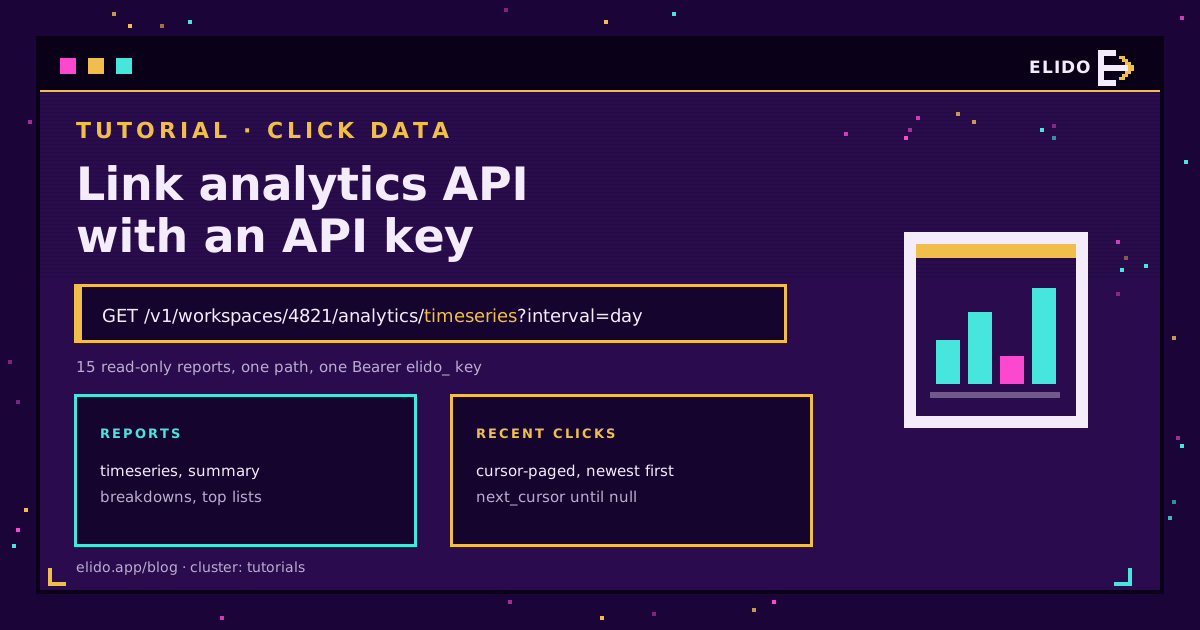
The Elido link analytics API is one endpoint, GET /v1/workspaces/{workspace_id}/analytics/{report} on https://api.elido.app, authenticated with a workspace API key. It serves 15 reports: click timeseries, an engagement summary, top links, a cursor-paged feed of recent clicks, and breakdowns by country, referrer, device, browser, host and destination. Dates default to the last 30 days, link_id narrows any report to one short link, and the CSV export, funnels, cohorts and LTV stay in the dashboard.
That's the whole answer if you only needed the URL. The rest of this guide is what I wish every click analytics API page said up front: the exact parameters, the JSON you get back, where the date range quietly works differently from what you'd assume, and a 30-line script that posts yesterday's numbers to Slack every morning.
Most people pulling click data are closing a loop that starts with campaign tagging, so if your links don't carry consistent UTMs yet, fix that first with end-to-end UTM tracking. Clean inputs make the stats worth pulling.
What the Link Analytics API Returns
Every report lives under the same path, and the report name is the last segment. Names with a slash (links/top, clicks/recent, breakdown/country) go in unencoded. Ask for anything outside the allow-list and you get a 404 with unknown analytics report.
| Report | Response shape | Good for |
|---|---|---|
timeseries | {items: [{ts, count}]} | Charts, day-over-day comparisons |
summary | flat object of five metrics | Daily digests, KPI tiles |
links/top | {items: [{link_id, slug, count}]} | "Which links carried the week" |
clicks/recent | {items: [click rows], next_cursor} | Near-real-time feeds, your own storage |
breakdown/country, /referrer, /device, /browser, /host, /destination | {items: [{key, count}]} | Pie charts, channel splits |
top-countries, top-referrers, top-destinations | {items: [{key, count}]} | Same data, flatter names |
top-regions, top-cities | {points: [{country, region or city, count}]} | Geo drill-downs below country level |
Notice the last row. The region and city reports wrap their rows in points, not items, because each row carries a country plus a region or city instead of one key. I've watched a generic parser choke on that exactly once. Once is enough.
The same surface backs the API and SDKs, the MCP server's analytics tool and the Get Analytics operation in the n8n node, so what you learn here carries over.
Authenticating With a Workspace API Key
API keys start with elido_ and belong to exactly one workspace. Send the key as a bearer token:
curl -s "https://api.elido.app/v1/workspaces/4821/analytics/summary" \
  -H "Authorization: Bearer $ELIDO_API_KEY"
The router checks two things before any query runs: that the key belongs to workspace 4821, and that it holds analytics.view. Every built-in role has that permission, Viewer included. So create a Viewer key for reporting jobs. A reporting cron has no business being able to delete links, and a Viewer key can't. A key without access gets a 403.
link_id doesn't widen access either. The workspace ID in the path is the one that was checked, so a link ID borrowed from someone else's workspace matches zero rows and returns an empty list. That's the right failure: boring, and nothing leaks.
Query Parameters for Click Stats: Dates, Timezone, Filters
Six parameters cover almost every short link stats API call you'll make:
fromandto, asYYYY-MM-DD. Leave both out and you get the 30 days up to now. Set onlyto, andfromdefaults to 30 days before it.link_idto scope any report to one link, andhostto scope to one redirect domain, handy when a workspace runs several branded domains.intervalfortimeseries, eitherhourorday(the default). Anything else fails the request.limitfor breakdowns and top lists, 1 to 200, default 50.links/topis the odd one: it returns 10 unless you ask for more.
Here's the detail that bites. Both dates are read as midnight UTC, and the window includes from but stops before to. For all of 21 September, send from=2026-09-21&to=2026-09-22. Send to=2026-09-21 and you get nothing from that day at all.
Timezone is the other one. Pass tz as an IANA time zone name, or set an X-User-TZ header, and timeseries cuts its hourly or daily buckets on local time. Only the buckets move. The from/to window is still UTC, so a Berlin "yesterday" needs a slightly wider window, which the script below handles. A typo like Europe/Berln returns a 400 with unknown IANA timezone, which beats a silently wrong chart.
curl -s -G "https://api.elido.app/v1/workspaces/4821/analytics/timeseries" \
  -H "Authorization: Bearer $ELIDO_API_KEY" \
  --data-urlencode "from=2026-09-01" \
  --data-urlencode "to=2026-09-22" \
  --data-urlencode "interval=day" \
  --data-urlencode "tz=Europe/Berlin" \
  --data-urlencode "link_id=918273"
Response Shapes You Can Code Against
A timeseries point carries ts, an RFC 3339 timestamp for the start of the bucket, and count. Buckets with zero clicks are simply absent, so fill the gaps yourself before you chart, or a quiet Sunday vanishes from the x-axis.
{
  "items": [
    { "ts": "2026-09-19T00:00:00Z", "count": 412 },
    { "ts": "2026-09-21T00:00:00Z", "count": 388 }
  ]
}
Breakdowns return {"items": [{"key": "DE", "count": 1204}, ...]}, sorted by count. The summary is a flat object:
{
  "total_clicks": 5310,
  "unique_visitors": 3987,
  "returning_visitors": 611,
  "avg_clicks_per_visitor": 1.33,
  "bounce_rate": 0.85
}
Two definitions matter. Unique visitors are counted by distinct IP address in the window, so an office behind one connection counts once. And bounce_rate is a fraction, not a percentage: the share of unique visitors who clicked only once in the window. It says nothing about what happened on your landing page, which is why these numbers never match GA4 sessions (the clicks vs GA4 sessions post walks through the gap). Every figure is bot-filtered before it reaches you, the same counts you see in Elido link analytics.
Paging Recent Clicks With a Cursor
clicks/recent is the link tracking API report that returns individual clicks, newest first. Each row has ts, link_id, slug, host, referer, country_code, device, browser, destination, user_agent and ip. Page size is 1 to 500, default 100.
When a page comes back full, the response carries a next_cursor. Pass it as ?cursor= to get the next, older page; null means you've reached the end of the window.
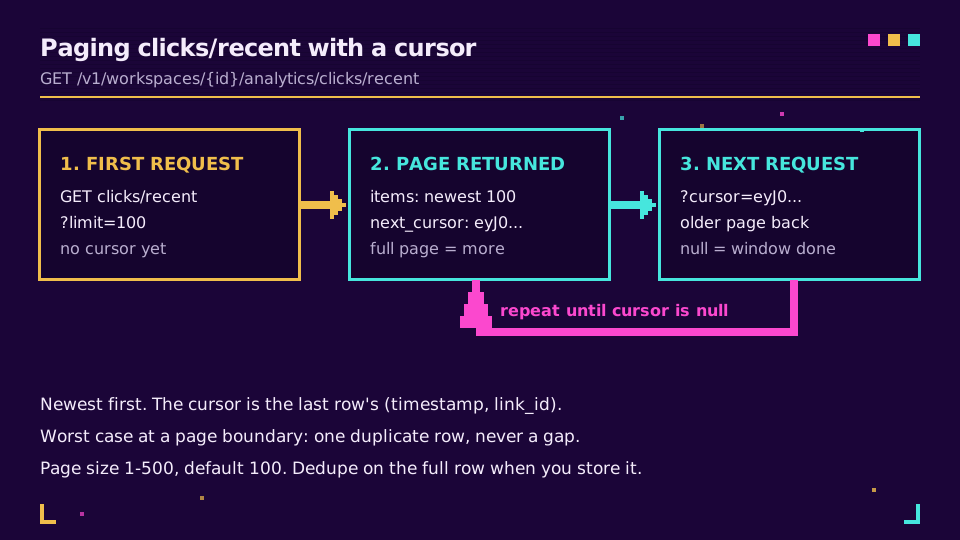
The cursor points at the last row's timestamp and link ID. Two clicks on the same link in the same millisecond can tie at a page boundary, and the worst case is one duplicate row, never a skipped one. Deduplicate on the full row when you store them. Rare, but a ten-line insert beats explaining an off-by-one to finance.
Those rows include IP addresses and user agents, so they're personal data. If you're copying them into a warehouse, keep it in the EU and set a retention period; the EU data residency guide for marketing teams covers the reasoning. For most reports you don't need raw rows at all, and a daily aggregate is kinder to everyone.
A Daily Click Report Script for Slack or a Sheet
Here's the job most people actually want: every morning, post yesterday's clicks and top five links to a channel. It uses only the Python standard library and a Slack incoming webhook.
import datetime as dt, json, os, urllib.parse, urllib.request
from zoneinfo import ZoneInfo

BASE = "https://api.elido.app/v1/workspaces/{ws}/analytics/{report}"
WS, KEY = os.environ["ELIDO_WORKSPACE_ID"], os.environ["ELIDO_API_KEY"]
TZ = ZoneInfo("Europe/Berlin")

def report(name, **params):
    url = BASE.format(ws=WS, report=name) + "?" + urllib.parse.urlencode(params)
    req = urllib.request.Request(url, headers={"Authorization": f"Bearer {KEY}"})
    with urllib.request.urlopen(req, timeout=20) as r:
        return json.load(r)

day = dt.datetime.now(TZ).date() - dt.timedelta(days=1)
# UTC window one day wider on each side, then keep only local hours of `day`
window = {"from": day - dt.timedelta(days=1), "to": day + dt.timedelta(days=2)}
hours = report("timeseries", interval="hour", tz="Europe/Berlin", **window)["items"]
total = sum(p["count"] for p in hours
            if dt.datetime.fromisoformat(p["ts"]).astimezone(TZ).date() == day)

top = report("links/top", limit=5, **{"from": day, "to": day + dt.timedelta(days=1)})
lines = [f"• {l['slug']}: {l['count']}" for l in top["items"]]
text = f"Clicks on {day} (Berlin): {total}\nTop links (UTC day):\n" + "\n".join(lines)

body = json.dumps({"text": text}).encode()
urllib.request.urlopen(urllib.request.Request(
    os.environ["SLACK_WEBHOOK_URL"], data=body,
    headers={"Content-Type": "application/json"}))
Run it from cron at 07:00 local. The hourly trick is what makes the total a real Berlin day instead of a UTC one; links/top has no tz, so its ranking stays on the UTC day, and the message says so.
Want a sheet instead? The same two calls work from Google Apps Script with UrlFetchApp and a daily trigger, appending one row per day. That's the cheapest path into a Looker Studio dashboard too.
If you're still pasting numbers out of screenshots every Monday, give a Viewer key to a script and have your mornings back.
What Stays Dashboard-Only
The API key surface is read-only and deliberately narrower than the dashboard. These aren't reachable with a key:
- The CSV click export (
clicks.csv). The dashboard's Download CSV button is the route for bulk files. - Funnels, cohorts, the LTV report, the time and geo heatmaps, and the traffic-quality view.
If a file landing somewhere on a schedule is all you need, the dashboard's scheduled email reports do that without code. For a full offboarding-grade pull, see what you can export from a short link account and how to check it's complete. And a combined "everything for one link" call doesn't exist yet, so a per-link dashboard means one request per report. The SDK quickstart covers running those in parallel and backing off when you hit the rate limits.
Polling the Click Analytics API vs Webhooks for Real-Time
Honest version: today, click data is pull-only. Elido webhooks push link and domain events, signed and retried, but a per-click click.created event is on the roadmap and not emitted yet. Anything real-time about clicks means polling clicks/recent.
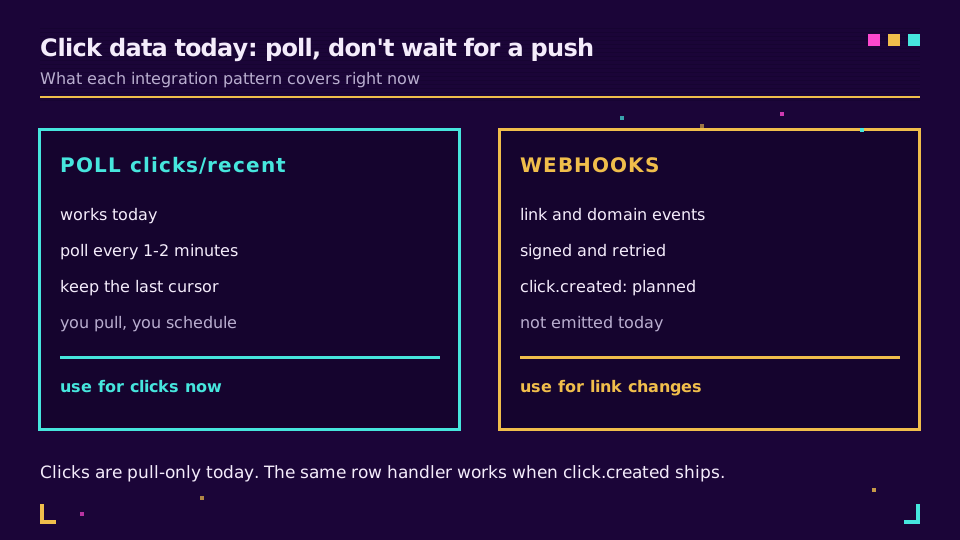
That's less painful than it sounds. Poll every minute or two, stop as soon as you reach a row you've already stored, and the load stays tiny, because a quiet minute is one small page. When click.created ships, the handler that processes a row won't care whether it came from a page or a push. The trade-offs in general are laid out in webhooks vs polling for click tracking, and if you're deciding which of these numbers deserve a report at all, what to measure in short link analytics is the shorter read.
My take: start with the daily summary. Almost every team that asks me for real-time clicks is happy with yesterday's numbers delivered before coffee.
Read the cornerstone → How to track UTM campaigns end-to-end
Related on the Blog
- URL shortener API and SDKs quickstart - keys, SDKs, rate limits and the create call.
- n8n URL shortener node - the same analytics reports inside an n8n workflow.
- Webhooks vs polling for click tracking - picking the integration pattern.
- Looker Studio link analytics - turning the daily pull into a dashboard.
- Connect Elido to Claude and Cursor with MCP - asking for click stats in plain language.
Frequently asked questions
Does Elido have an analytics API for short link clicks?
Yes. A workspace API key can call GET /v1/workspaces/{workspace_id}/analytics/{report} on api.elido.app and read 15 reports: timeseries, summary, top links, recent clicks, six breakdowns and five top lists. The key needs the analytics.view permission, which every built-in role, Viewer included, already has.
How do I get click stats for one short link through the API?
Add link_id to the query string of any report. The numeric link ID narrows timeseries, summary, breakdowns and recent clicks to that single link. The workspace in the path still decides access, so a link ID from another workspace just returns no rows instead of leaking data.
Can I export click data as CSV through the API?
Not with an API key. The CSV click export, funnels, cohorts and the LTV report are dashboard-only. For a scripted feed, page through the clicks/recent report with its cursor and write the rows yourself, or schedule an email report from the dashboard if a file in an inbox is enough.
What timezone does the link analytics API use?
The from and to dates are read as UTC calendar days. For the timeseries report you can pass tz as an IANA name such as Europe/Berlin, or send an X-User-TZ header, and the hourly or daily buckets are cut in that zone. An unknown zone name returns a 400 error.
Can I get a webhook for every click on a short link?
Not yet. A per-click click.created webhook is on the roadmap but is not emitted today, so webhooks currently cover link and domain events only. For near-real-time click data, poll the clicks/recent report on a short interval and keep the last cursor between runs.
Which API key role can read click analytics?
Any built-in role. Reading analytics needs analytics.view, and the Viewer role already has it, so the safest choice for a reporting script is a Viewer key. It can read every allowed report but cannot create, edit or delete links if the key ever leaks from a cron box.
Try Elido
Paste a URL, get a working short link
No signup. Link lives for 30 days. Sign up to keep it forever.
Free, no signup required · 2 per day