First touch gives 100% of a sale's credit to the first thing that reached the customer. Last touch gives 100% to the final thing before they bought. Linear splits it evenly, time decay favors recent touches, and position-based hands 40% to each end and 20% to the middle. They are five ways to divide the same revenue, and on one real-looking journey they can credit five different channels.
That gap is the whole story of first touch vs last touch attribution. The model you pick is not a measurement, it is an opinion about what deserves the credit, and it quietly decides which channel gets budget next quarter. This guide runs all five models on one campaign you can picture: a QR code on a poster, a short link in a newsletter, and a reminder email. If you want the broader definition first, start with what marketing attribution is, then come back for the arithmetic.
I work on how these numbers get built from link data, and the most common mistake I see is not choosing the wrong model. It is choosing one without ever looking at what the others would say.
The Campaign We Will Score
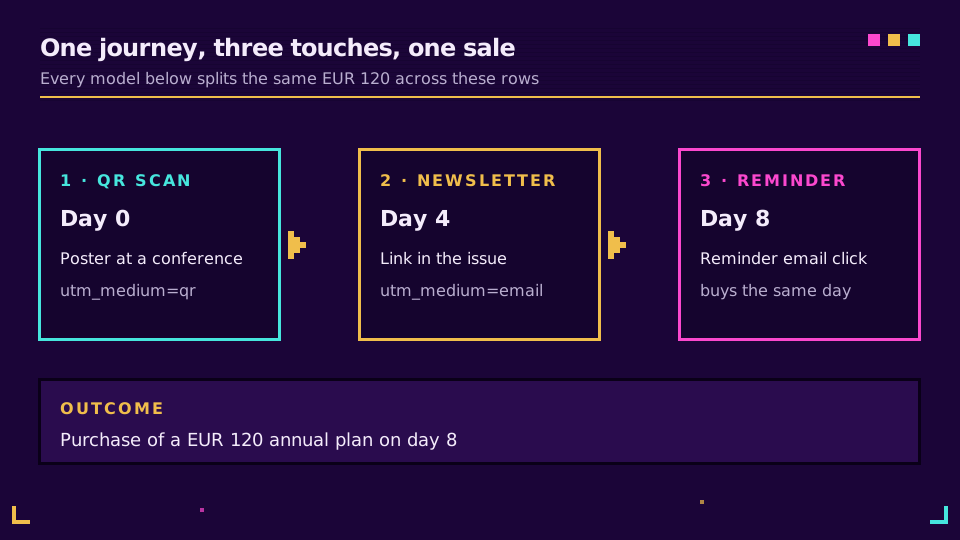
A customer, Maya, buys a EUR 120 annual plan. Her path, as the click log would show it:
- Day 0: she scans a QR code on a conference poster. It points to a short link tagged
utm_medium=qr. - Day 4: she clicks the short link in your newsletter, tagged
utm_medium=email&utm_campaign=newsletter. - Day 8: she clicks a reminder email and buys the same day.
Three touches, one conversion, EUR 120 to hand out. Each short link carries its own campaign tags, which is what makes the touches distinguishable at all. If tagging is the shaky part of your setup, UTM parameters explained covers the conventions, and tracking UTMs end to end covers the plumbing.
The Five Models Scored
Each model below takes Maya's EUR 120 and applies one rule. Read them in order, because the later ones are reactions to the earlier ones.
First touch attribution
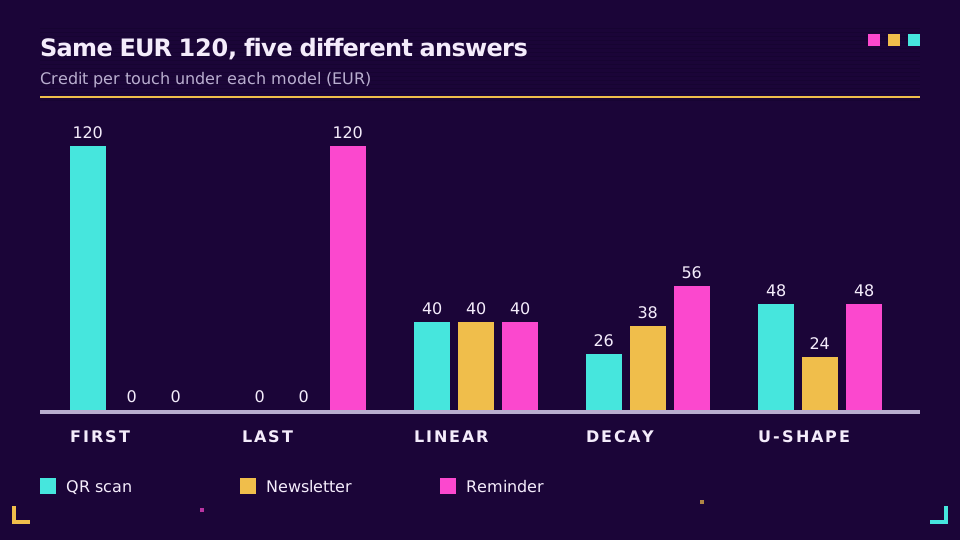
First touch assigns the full EUR 120 to the QR scan. The logic is that the first interaction created the opportunity, and everything after was the customer already being on the way.
It earns its keep when your question is "where do new customers come from?" Awareness channels such as posters, podcasts, events and creator links look weak under last touch because they rarely close anything on their own. Shopify's overview of the model frames it the same way: it measures the top of the funnel.
The catch: it gives zero credit to the emails that did the persuading. Read only first touch and you will keep funding the poster and starve the nurture sequence that turned a scan into a sale. It also rewards whatever happens to be first, including a lucky early click from someone who was always going to buy.
Last touch attribution
Last touch assigns the full EUR 120 to the reminder email. It is the default in most analytics tools, and for good reason: it is simple, it is reproducible, and it matches how the click right before a purchase is easiest to observe.
It works well for short cycles, repeat purchases and direct-response campaigns, where the final nudge really is the decision. Factors.ai's comparison makes the same point for B2B: both single-touch models are simple and both are incomplete once the journey has several people and several steps.
It over-credits the closer. Reminder emails, branded search and retargeting all sit at the end of the journey by nature, so last touch flatters them every time. Maya's reminder email got her over the line, but it only existed because the QR scan and the newsletter put her on the list. Last touch also tends to inflate "direct" traffic when the final visit is a typed URL.
Linear attribution
Linear divides the credit equally. Three touches, EUR 40 each.
It is the model for people who distrust everyone's story. Nothing is invisible, and nobody gets a bonus for position. It is a reasonable first step away from single-touch because it cannot fully ignore any channel that appeared.
But it assumes a poster scan and a purchase-day reminder contributed the same. They almost never did. Linear also dilutes credit as journeys get longer, so a ten-touch path gives each step 10% and makes everything look unimportant.
Time decay attribution
Time decay gives more weight to touches nearer the conversion, usually with a half-life. With a 7-day half-life, a touch loses half its weight for every 7 days between it and the purchase. Maya's touches were 8, 4 and 0 days before buying, which gives weights of about 0.45, 0.67 and 1.00. Normalized, that is roughly 21%, 32% and 47%.
It suits promotions and fast purchases where recent really does mean influential. It is also the model with a hidden dial: change the half-life from 7 days to 30 and the numbers shift a lot, so the choice of half-life is a decision, not a default.
Long cycles break it. If a deal takes six months, the touch that started it decays to almost nothing by the time it closes, so time decay quietly turns into last touch with extra steps.
Position-based attribution
Position-based, often called U-shaped, gives 40% to the first touch, 40% to the last, and 20% shared among the middle. For Maya that is EUR 48, EUR 24 and EUR 48.
It encodes a belief many marketers already hold: the step that found the customer and the step that closed them deserve most of the credit, and the middle did supporting work. It tends to feel right for journeys with a clear discovery step and a clear closing step.
The 40/20/40 split is a convention, not a finding. Nobody measured it on your business. If your middle touch (say, a webinar) is the real reason people buy, position-based will under-credit it by design.
The Five Models Side by Side
Here is the same EUR 120 under every model. Each column sums to EUR 120.
| Touch | First | Last | Linear | Time decay (7-day) | Position-based |
|---|---|---|---|---|---|
| QR scan, day 0 | 120.00 | 0.00 | 40.00 | 25.56 | 48.00 |
| Newsletter click, day 4 | 0.00 | 0.00 | 40.00 | 37.99 | 24.00 |
| Reminder email, day 8 | 0.00 | 120.00 | 40.00 | 56.45 | 48.00 |
Read the table by rows. The QR code is worth anywhere from EUR 0 to EUR 120 depending on the model, and the newsletter, which both single-touch models ignore, gets between EUR 0 and EUR 40. None of these is wrong. They answer different questions: first touch answers "what finds customers", last touch answers "what closes them", and the multi-touch models answer "how do I stop arguing about it".
If you only have time for one habit, make it this: compute first and last side by side for every campaign. When they agree, you can stop worrying. When they disagree sharply, you have found a channel doing a different job from the one your report assumes.
What No Model Can Fix
All five share one blind spot. They only divide credit among touches you can see. A link pasted into a private chat, a colleague mentioning your name, a podcast heard last month: none of it enters the model, and the credit lands on whatever was visible. Dark social attribution is the long version of that problem, and it is worth knowing before you trust any model's output.
One more caveat, from experience. Google removed first click, linear, time decay and position-based from GA4 and Google Ads in November 2023, leaving data-driven and last click (GA4 attribution models report, Google Ads: about attribution models). If your analytics tool no longer shows the models above, that does not make them obsolete. It means you compute them yourself, which is easy once you have per-touch rows.
What Click-Level Data Can and Cannot Tell You
A short link records the click itself, which is the most reliable touch in a campaign because it happens on infrastructure you control. A click event carries the link, the timestamp, country, device class, browser, referrer host and the UTM tags, and it does so without cookies or a stored IP address (see click event fields). That makes it a clean source of "touch" rows, including for QR scans you track as links and email clicks you can tell apart.
Here is what it can answer well:
- Which channel touched first, and which touched last, in a given window.
- How long the gap was between touches, which is exactly what time decay needs.
- Which campaign tags are doing the heavy lifting at each position.
And here is what it cannot:
- Who the person is. A click row on its own has no identity. To link Maya's three clicks you need an identifier that shows up in both the clicks and the conversion.
- Whether a click was a human. Mail scanners and chat previews open links. Clicks versus GA4 sessions explains why the numbers differ and what is normal.
- What happened off the link. Views of a poster with no scan, an ad impression with no click, and a recommendation over lunch are all invisible.
- Cross-device stitching. Scan on a phone, buy on a laptop, and the two journeys look like two people unless something ties them together.
In Elido, a conversion matches back to a click either exactly, through the click ID returned with the redirect, or by customer email against the most recent click inside your attribution window (1, 7, 30 or 90 days). That default is last-touch matching, and it is exact when you pass the click ID. The funnel builder also lets you choose first touch, last touch or linear for a funnel. Time decay and position-based are not built in. For those, export the click events and conversions (see exporting analytics data and the link analytics API), join them on your identifier, and run the weights in a spreadsheet or your warehouse. The arithmetic above is all it takes.
If you want the touch rows without building a pipeline first, create a tagged short link in Elido for each channel in your next campaign and start with the first-versus-last comparison.
Which Model Should You Use
Match the model to the decision you are making, not to what a tool defaults to.
- Short cycle, direct response, repeat buyers: last touch, with time decay as a sanity check.
- Brand and awareness spend, new-customer questions: first touch for the budget decision, last touch to see what converts it.
- Journeys with a clear find step and a clear close step: position-based, accepting that the 40/20/40 weights are an assumption.
- Long B2B cycles with many stakeholders: none of the simple models is enough. Treat a rules-based model as a rough guide and look at sequences and cohorts.
In every case, cookieless attribution limits are worth reading before you trust a number to the euro. And pair any model with the click-to-conversion setup in Elido's conversion tracking so the conversion side has an identifier to join on.
The honest conclusion is that attribution is closer to bookkeeping than to physics. The models do not discover the truth, they apply a rule consistently so you can compare campaigns. Pick a rule, say what it is, and keep it stable long enough to learn something.
Read the Cornerstone Series
This post sits in the features cluster, alongside the definitions in what marketing attribution is. For the end-to-end tagging and forwarding setup, read the UTM tracking cornerstone.
Related on the Blog
Frequently asked questions
What is the difference between first touch and last touch attribution?
First touch gives 100% of the credit to the first interaction a customer had with you, and last touch gives 100% to the final interaction before the conversion. First touch tells you what created awareness. Last touch tells you what closed the sale. Neither sees the touches in between.
Which attribution model is best?
There is no universally best model, only the one that fits your sales cycle and the question you are asking. Short, impulse-driven purchases are served well by last touch or time decay. Longer journeys with a clear discovery step and a clear closing step suit position-based. Run two models side by side and treat the gap between them as the uncertainty.
What is the difference between linear and time decay attribution?
Linear attribution splits credit equally across every touchpoint, while time decay gives more credit to touches closer to the conversion. Linear treats a cold first impression and a final reminder as equals. Time decay assumes recency equals influence, usually with a half-life such as 7 days.
What is position-based attribution?
Position-based (also called U-shaped) attribution gives 40% of the credit to the first touch, 40% to the last touch, and splits the remaining 20% evenly across the touches in the middle. It rewards the step that started the journey and the step that finished it. With only two touches the credit simply splits 50/50.
Does GA4 still offer first click, linear, time decay and position-based models?
No. Google removed first click, linear, time decay and position-based from GA4 and Google Ads in November 2023, leaving data-driven and last click. If you want the rules-based models back, you have to compute them yourself from exported event data.
Can click data alone support multi-touch attribution?
Only partly. Click data records which link was followed, when, and with what campaign tags, but it does not know who the person is. To weight several touches you need an identifier shared between the clicks and the conversion, such as a click ID passed through to your checkout or an email address captured at conversion.
Try Elido
Paste a URL, get a working short link
No signup. Link lives for 30 days. Sign up to keep it forever.
Free, no signup required · 2 per day