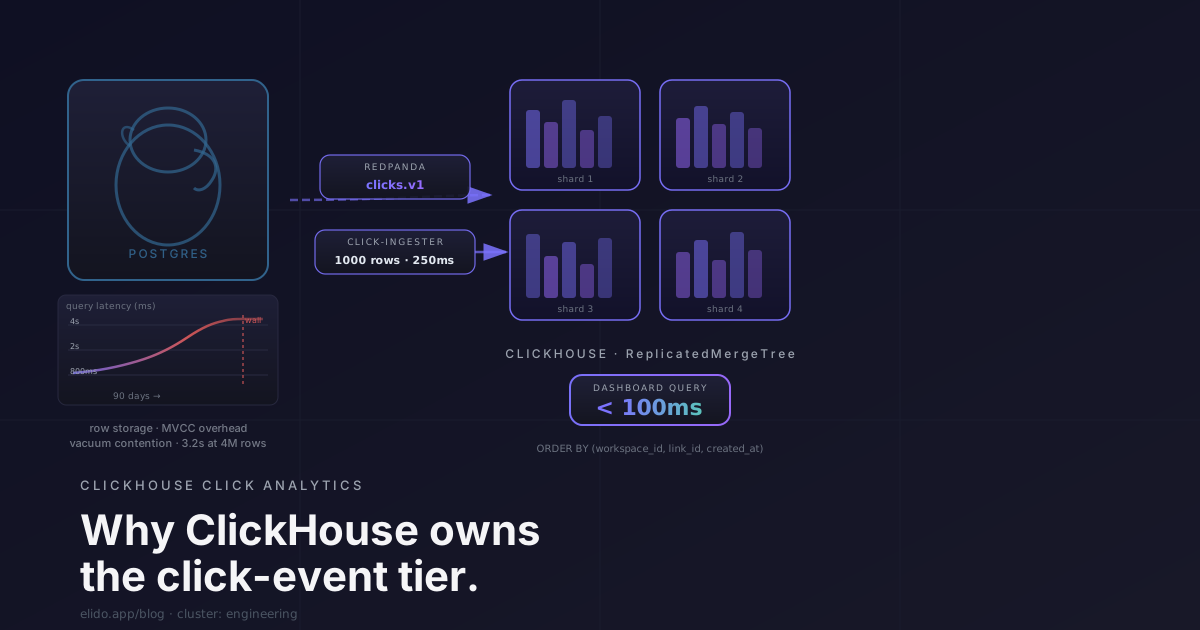
Postgres is excellent. We use it heavily, and we trust it. It stores every link, every workspace, every billing record, every user. But at around the 90-day mark on a growing URL shortener, you run into a wall if you're also storing raw click events there. The wall isn't dramatic - Postgres doesn't fall over, it just gets slower in the specific, frustrating way that aggregate queries on large append-only tables get slower. Index scans stop helping. Autovacuum can't keep up. A dashboard that loaded in 800ms now loads in 4 seconds. You add more indexes. It gets worse.
This post explains why we moved click events to ClickHouse, what the schema looks like, how the ingestion path works, and where the sharp edges are. It's a companion to the redirect latency post and covers the data tier that sits downstream of the redirect - the part that turns raw click-fire-and-forget events into the dashboards on the analytics solutions page.
TL;DR
- Click events are append-only and aggregate-query-shaped. Columnar storage wins on both counts.
- Postgres's row-per-event overhead, index bloat, and vacuum contention compound past ~30M events on a shared table.
- ClickHouse with
ORDER BY (workspace_id, link_id, timestamp)returns 90-day per-workspace rollups in under 100ms with no extra indexes. - Link metadata stays in Postgres (mutable, transactional); click events stay in ClickHouse (append-only, analytical). The split is clean because the two don't need to overlap at write time.
Why Postgres struggles with this workload
The workload shape is the problem. A click event is:
- Written once and never updated.
- Written at high, bursty rates - 50:1 write-to-read ratio is a rough estimate, and on a campaign launch day the ratio spikes further.
- Queried in aggregate: total clicks per link, geo breakdown for a workspace, device split across a campaign's top 100 links. Almost nobody queries a single click row directly.
Postgres is built for a different set of assumptions. Every row carries a tuple header, transaction ID fields (xmin, xmax), and visibility metadata. For transactional workloads where you update rows in place and need MVCC to handle concurrent reads and writes, that overhead is the price you pay for correctness. For append-only analytical data you never touch again, it's pure waste.
The index problem is worse. Postgres's B-tree indexes work well for selective point-lookups - finding the row with link_id = 'xyz'. They help less when you're running GROUP BY link_id, country across 10 million rows for a workspace. The index narrows the scan, but the query still has to pull decompressed row data from heap pages, deserialize it, aggregate it. At 30M rows the query is slow. At 100M rows it's painful.
Autovacuum makes this worse in practice. High-throughput inserts generate dead tuples (MVCC row versions that are no longer visible to active transactions but haven't been cleaned up yet). Autovacuum reclaims them, but it competes with live queries for I/O. You'll see periodic latency spikes on your Postgres dashboards that correspond to autovacuum running on the events table. The TimescaleDB compression and chunk architecture docs are worth reading for the specifics of how a Postgres extension tries to work around this - the problem is real enough that a dedicated time-series layer on top of Postgres exists to address it.
We ran clicks in Postgres through the first 90 days of the project. A workspace with ~4M click events had a dashboard that took 3.2 seconds to render a 7-day rollup by country. Adding a partial index on (workspace_id, created_at) got it to 1.4 seconds. Good enough at the time; clearly not a path that scales as click volume grows by orders of magnitude.
Why ClickHouse fits
ClickHouse is a columnar database engine built explicitly for analytical workloads - accessed 2026-05-12. Columnar means the data for each column is stored contiguously on disk rather than interleaved row-by-row. For a query like "sum click count by country for workspace X over the last 30 days", the engine only reads the country_code, workspace_id, and timestamp columns. It never touches user_agent or referer. The I/O reduction on wide tables with many columns is substantial.
The compression ratio is the second property. Columnar data compresses significantly better than row data because repeated values in the same column - the same workspace_id appearing thousands of times, the same set of 60-odd country codes, a handful of device values - compress to almost nothing under ClickHouse's LZ4 and ZSTD codecs. Low-cardinality columns like these are where columnar codecs gain the most over Postgres row storage. That's not just a storage win - smaller on-disk data means more of it fits in the OS page cache, which means fewer disk reads per query.
The third property is the MergeTree engine family - accessed 2026-05-12. MergeTree tables sort and cluster data by the table's ORDER BY key. Queries that filter or group on the leading columns of that key only read the data parts that overlap with the filter range. This is ClickHouse's equivalent of a clustered index, except it's mandatory (you define it at table creation time) and applies to every query, not just indexed columns.
We use ORDER BY (workspace_id, link_id, timestamp). A query for workspace 123's clicks in the last 7 days reads only the data parts where workspace_id = 123 appears, then within those parts reads only the time-range slice. On 90 days of click data, this typically touches 3-8% of total data parts. The sparse primary index ClickHouse maintains over the ORDER BY columns makes this targeting efficient without requiring a dense B-tree for every query pattern. ReplicatedMergeTree adds HA - two or more ClickHouse nodes with ZooKeeper-equivalent coordination (ClickHouse Keeper), replicating parts as they're written. We don't run that yet: production is a single host, with one ClickHouse server on plain MergeTree. Replication is the planned next step once one server stops being enough.
The schema we ship
CREATE TABLE IF NOT EXISTS click_events
(
    timestamp       DateTime64(3, 'UTC'),
    link_id         UInt64,
    workspace_id    UInt64,
    domain_id       UInt64,
    slug            LowCardinality(String),
    host            LowCardinality(String),
    user_agent      String,
    referer         String,
    ip              String,
    country_code    LowCardinality(FixedString(2)) DEFAULT '',
    device          LowCardinality(String) DEFAULT '',
    browser         LowCardinality(String) DEFAULT '',
    destination     String DEFAULT '',
    retention_days  UInt16 DEFAULT 730,
    INDEX idx_workspace workspace_id TYPE bloom_filter GRANULARITY 4,
    INDEX idx_link      link_id      TYPE bloom_filter GRANULARITY 4
)
ENGINE = MergeTree()
PARTITION BY toYYYYMM(timestamp)
ORDER BY (workspace_id, link_id, timestamp)
TTL toDateTime(timestamp) + toIntervalDay(retention_days);
That is the base table. Later migrations add region, city and approximate coordinates, a daily visitor hash, and bot, scanner and suspicion flags with ALTER TABLE ... ADD COLUMN.
A few schema decisions worth calling out.
LowCardinality(String) on slug, host, country_code, device, browser - these columns have bounded or highly repetitive values (a few hundred custom hostnames, 250-odd country codes, a handful of device types). The IDs are plain UInt64, which compress well on their own. LowCardinality activates dictionary encoding, which stores the values as integer references into a dictionary of unique strings. Query speed on these columns improves materially; compression improves further. We learned this from the ClickHouse docs on low-cardinality data type - the rule of thumb is that any string column with fewer than 10,000 distinct values is a candidate.
PARTITION BY toYYYYMM(timestamp) creates a separate data partition per calendar month. Whole old partitions can be dropped (or moved to slower storage) with a single ALTER TABLE click_events DROP PARTITION '202501' statement, which is instant - no full-table scan. A partition holds every workspace's clicks for that month, though, so per-plan retention can't be a partition drop. Instead each row is stamped at ingest with its workspace's window in retention_days (90 days on Free, 365 on Pro, 730 on Business), and the TTL clause removes expired rows as ClickHouse merges parts.
ip stores the truncated address: the edge zeroes the last octet of an IPv4 address (203.0.113.0 not 203.0.113.42) and keeps the first 48 bits of an IPv6 one, before the click event leaves the redirect process. Geo lookup happens at the edge before truncation, so country, region, city and approximate coordinates are stored with the click, along with the full user agent. A truncated IP plus city and user agent should still be treated as personal data. The analytics solutions page linked above covers the full privacy architecture.
The ingestion path
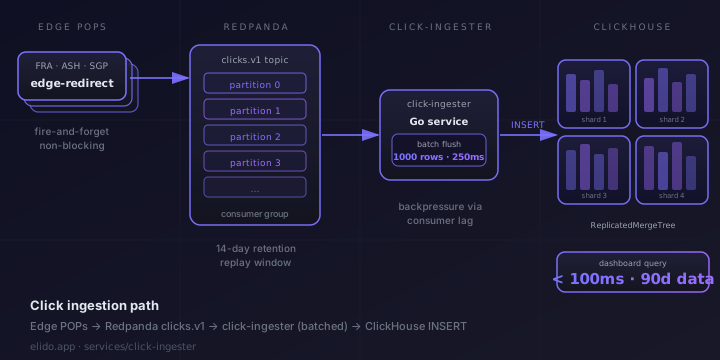
The redirect handler in the edge service is fire-and-forget. It appends a click event to a Redpanda topic (clicks in production) and issues the 302. It does not wait for acknowledgement from ClickHouse. If Redpanda is unavailable at that moment, the click is dropped - the redirect is not. The hierarchy is deliberate: a missed click is recoverable (we can reconstruct approximate counts from access logs); a failed redirect is user-visible.
Redpanda consumer groups - accessed 2026-05-12 - provide the delivery guarantee between the edge and the ingester. The click-ingester service runs as a consumer group against the clicks topic. Production runs one ingester today; the consumer group is what will let a second instance take over partitions, and fail over within the group's heartbeat timeout, when we add one.
The ingester accumulates events in memory and flushes in batches: 1,000 rows or 5 seconds, whichever comes first. This is important. ClickHouse's MergeTree engine is optimized for bulk inserts - it writes each insert as a new data part, and lots of tiny inserts generate lots of tiny parts, which triggers aggressive background merging and slows queries during the merge load. The ClickHouse docs recommend inserts of at least 1,000 rows to keep the number of parts manageable. We flush at 1,000 rows / 5 seconds and have not seen part-count issues in normal operation.
Backpressure propagates through Redpanda. The ingester commits a record's offset only after its batch is written to ClickHouse, so if ClickHouse is slow or restarting, failed batches are retried and consumer lag grows, which is the leading indicator of data freshness problems. If the ingester itself restarts, uncommitted records are read again from Redpanda, within the topic's retention window.
The architecture is described in more detail at /docs/guides/clickhouse-export.
Postgres vs ClickHouse: the split
Two databases for one service is a cost that needs justification. The justification here is that the two workloads are genuinely incompatible at scale, and the data doesn't overlap in a way that requires synchronous coordination.
Postgres owns link metadata: the links, workspaces, users, billing, rules tables. These are mutable (links get archived, destination URLs change, billing records get updated), transactional (creating a link and minting its slug must be atomic), and read-heavy relative to writes. B-tree indexes and MVCC are exactly what you want.
ClickHouse owns click events: the click_events table. These are append-only (a click, once written, is never updated), write-heavy, and queried in aggregate patterns that columnar storage handles better. There are no cross-database joins at write time - the ingester inserts click events with workspace_id and link_id as denormalized numeric fields. At query time, the analytics API may look up link metadata from Postgres and click counts from ClickHouse separately, then join in application code. That's one extra network round trip; it's a much better trade than putting the analytical query load on Postgres.
The Citus distributed Postgres documentation describes the alternative: distributed Postgres extensions designed to handle time-series analytical workloads. We evaluated this path and concluded that ClickHouse's query performance and compression ratio are far enough ahead for pure-analytical workloads that the operational overhead of two databases is worth it. If your workload is mixed - some analytical, lots of row-level mutations - the Citus approach makes more sense.
Query patterns we hit hourly
The dashboard refreshes for each workspace on approximately a 60-second cycle. There are three heavy queries:
Per-link click rollup, last 24 hours. The top of every link list shows a sparkline. This is a GROUP BY link_id, toHour(timestamp) over the last 24 hours for the workspace.
Country breakdown for a campaign. A marketing team checking campaign performance wants GROUP BY country_code, COUNT(*) filtered to the campaign's links over a date range.
Device split, top-100 links. The analytics tab shows a device/OS breakdown. This is GROUP BY device, browser, COUNT(*) for the workspace's highest-traffic links over the last 30 days.
All three patterns are served well by the ORDER BY (workspace_id, link_id, timestamp) clustering. The workspace filter prunes the scan to the right slice of data immediately; the link_id and timestamp columns further narrow it for the first two patterns. The device split query scans more columns but still benefits from the workspace-level clustering.
A representative query for the top-100 links by click count over the last 24 hours:
SELECT
    link_id,
    count() AS clicks_24h
FROM click_events
WHERE
    workspace_id = 123
    AND timestamp >= now() - INTERVAL 1 DAY
GROUP BY link_id
ORDER BY clicks_24h DESC
LIMIT 100
The query reads only the partitions in the date range and only the columns it names, so its cost grows with the slice you ask for rather than with the whole table. The equivalent Postgres query has to walk rows, which is where the 1.4 seconds above came from.
We do not use ClickHouse materialized views for these patterns. The ORDER BY clustering and partition pruning are sufficient, and materialized views add schema-migration complexity. If query latency ever becomes a problem at higher event volumes, materialized views are the next lever - not additional indexing.
Failure modes we plan for
Production runs one ClickHouse server, one Redpanda broker and one ingester on a single host, so the failure modes worth writing down are the ones that setup has today and the ones that arrive with the scale-out we have planned.
ClickHouse restarts. On one server, a ClickHouse restart or upgrade pauses inserts. The ingester keeps the failed batch in memory, retries it, and commits Redpanda offsets only after a successful insert, so clicks wait instead of disappearing. The visible effect is a gap in live dashboard data until the backlog drains. One gap we know about: the in-memory buffer has no upper bound while ClickHouse is down, which is on our backlog. Replication with ReplicatedMergeTree and ClickHouse Keeper is the planned fix for this pause, and it brings its own: a Keeper leader election also stalls inserts on replicated tables for a short while, so Keeper nodes need to sit on separate hosts.
Ingester partition balance. Today one ingester owns every partition of the clicks topic. When we add a second instance, the consumer group's assignment strategy decides how evenly partitions are shared, and an uneven split shows up as one instance batching slowly while the other idles. The thing to watch is per-instance consumer lag, not just the group total.
Async ALTER TABLE. We've added columns to click_events several times (region, city, lat and lng, visitor_hash, the scanner flags). ClickHouse's ALTER TABLE ... ADD COLUMN acknowledges immediately and does not rewrite existing parts; rows in older parts return the column's default (an empty string or zero) until merges materialise it. Nothing breaks, but a query that treats an empty city as "no city" will count old rows wrongly. The lesson: treat ALTER TABLE on large ClickHouse tables as eventually consistent, and pick defaults you can tell apart from real values.
What we don't do in ClickHouse
Two things that come up in conversations and that we've deliberately avoided.
Per-event joins to Postgres tables. Some analytics queries naturally want to join click events to link metadata - "show me all clicks for links tagged 'campaign-q2', with their destination URLs". Doing this as a federated query (ClickHouse click_events joined to Postgres links via a ClickHouse JDBC table function) is possible but slow. Instead, we either denormalize relevant fields into the click event at ingest time (like destination, the URL the visitor was actually sent to) or resolve the join in application code: two separate queries, merged in the analytics API layer. This keeps both databases operating inside their performance envelopes.
Per-row updates. ClickHouse supports ALTER TABLE UPDATE for row-level mutations, but it's an async, resource-intensive operation that works against the engine's assumptions. If you find yourself needing to update a click event after the fact - say, to retroactively mark it as a bot click - you've built the architecture wrong. We decide those flags before the insert: the edge scores suspicious clicks and classifies link scanners and anonymizing networks before it emits the event, so is_suspicious, is_scanner and anonymizer_type are written with the row. If a score ever had to be computed later, the pattern would be a separate table joined at query time. Reads are cheap; retroactive updates are expensive and should be rare.
For the broader infrastructure picture - how the edge redirect interacts with Redpanda, how click deduplication works, and how the click-ingester service fits into the service topology - see /docs/guides/clickhouse-export. The edge-side story (fire-and-forget Redpanda publish, latency budget) is in the redirect p95 post. For what the data enables downstream - geo breakdowns, device splits, UTM attribution dashboards - the solutions/analytics page covers the product surface. If you're building link campaigns against the API and care about which query patterns the SDK exposes, solutions/developers is the relevant entry point.
For teams evaluating Elido as link infrastructure, the architecture choice here - ClickHouse for clicks, Postgres for everything else - is also what allows us to offer no-sampling analytics. The smart links explained post covers how the routing decisions that generate these click events work at the edge.
Marius Voß is DevRel and edge infra at Elido. He helped design the click-ingester pipeline and has spent more time than he'd like reading ClickHouse merge logs.
Try Elido
Paste a URL, get a working short link
No signup. Link lives for 30 days. Sign up to keep it forever.
No signup needed. Sign up free for 50 links a month.