A redirect blocks the visitor. They click a short link, the browser waits, and nothing else loads until the 302 comes back. That's why services/edge-redirect has a latency budget instead of a "fast enough" feeling: p50 5ms and p95 15ms on a cache hit.
Read that as a target, not a result. The budget is written down in the service README and in the on-call runbook, and our load-test acceptance bar is built on it. We don't have a committed benchmark or load-test result file that proves a per-region percentile, so this post doesn't print one. It describes, from the code, what the hot path does and, just as useful, what it refuses to do.
TL;DR
- The edge is a Go service on a low-allocation Go HTTP library, running on a single production host behind a reverse proxy today, with a multi-region edge planned.
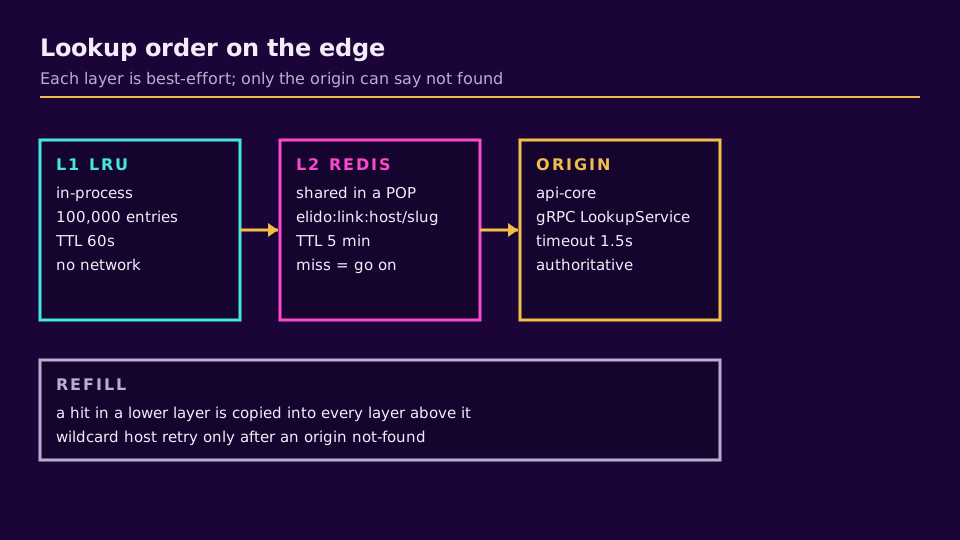
- Lookup walks an in-process LRU (100,000 entries, 60-second TTL), then a shared in-memory cache (5-minute TTL), then api-core over gRPC with a 1.5-second timeout.
- The click event is produced from a separate goroutine. The visitor never waits for it.
- Budget: p50 5ms, p95 15ms on a cache hit. These are targets, and measured percentiles aren't published here.
Why the budget exists
Redirect time is added to everything after it. If a campaign link sends traffic to a landing page, the redirect is part of that page's time to first byte. A budget forces a decision whenever someone wants to add work to this path: it fits, or it moves to a worker.
The numbers in services/edge-redirect/README.md:
| Percentile | Cache hit | Cache miss |
|---|---|---|
| p50 | 5ms | 40ms |
| p95 | 15ms | 100ms |
| p99 | 30ms | 200ms |
They're a design target. If you need measured numbers for a vendor review, run the k6 scenario described at the end of this post against your own links and keep the output.
The request path, step by step
internal/handler/redirect.go documents the flow at the top of the file. In order:
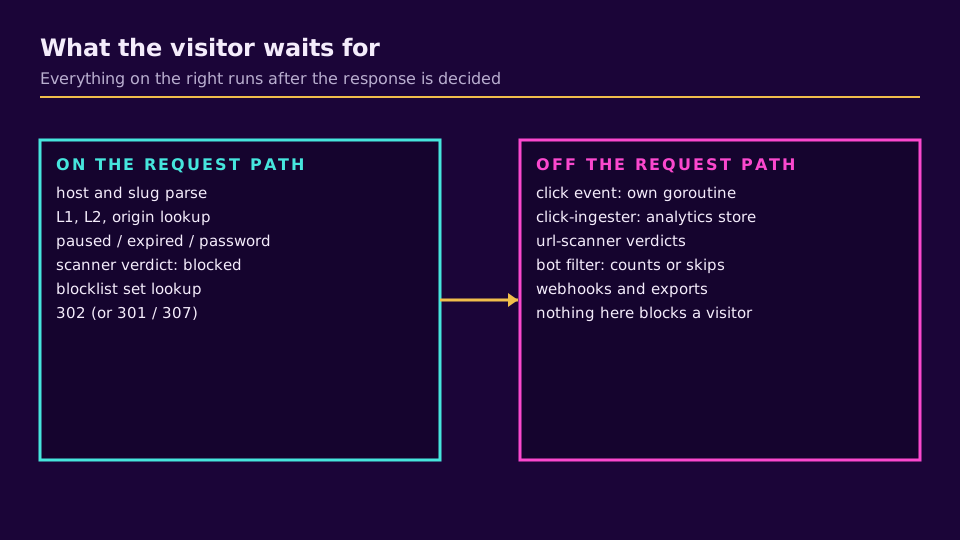
- Lowercase the host and take the slug from the path.
resolver.Resolvewalks L1, then L2, then the origin.- Short-circuit on state: a paused workspace, an expired link, a password-protected link (the visitor goes to the unlock page and no click is emitted), a link the url-scanner marked
blocked(451), and a destination host on the admin blocklist. - Fire the click event without waiting for it.
- Answer with
302unless the link says301or307.
Everything in step 3 is a field on the cached link record or a lookup in an in-memory set. The blocklist matcher, for example, is synced from api-core in the background, so checking it costs a couple of map lookups, not a database call.
Link previews (a slug ending in +), AI-agent requests that ask for JSON, and end-to-end encrypted links take different branches before the redirect. None of them touch Postgres.
The three lookup tiers
Each tier is small on purpose, and each one is best-effort except the last.
L1, in-process LRU. internal/cache/lru.go wraps hashicorp/golang-lru/v2/expirable. The size is L1Size: 100_000 entries and the TTL is L1TTL: 60s, both set in internal/config/config.go. The TTL exists so a disabled or deleted link can't be served forever by one node. The key is host + "/" + slug, so the same slug on two domains doesn't collide.
L2, shared cache. internal/cache stores the link as JSON, keyed by host and slug, with L2TTL: 5m. It's shared by the edge instances. A nil client is legal: the cache methods return a miss and the edge keeps working.
Origin, gRPC to api-core. internal/origin/origin.go supports two transports. REST (GET /v1/lookup) is the default when nothing else is configured. gRPC (elido.v1.LookupService.Resolve) is used once GRPC_ORIGIN_ADDR is set, and it's the production choice. The call is bounded by OriginTimeout, 1.5 seconds.
The resolver is short enough to quote the important part:
if v, ok := r.l1.Get(key); ok {
    return v, nil
}
if v, ok := r.l2.Get(ctx, key); ok {
    r.l1.Set(key, v)
    return v, nil
}
link, err := r.origin.Resolve(ctx, host, slug)
if err != nil {
    return nil, err
}
r.l1.Set(key, link)
r.l2.Set(ctx, key, link)
return link, nil
A hit in L2 refills L1. A miss in both goes to api-core and refills both. Only the origin may say "not found"; if it does, the resolver retries once with a wildcard parent host (abc.example.com becomes *.example.com) for wildcard custom domains.
What this design doesn't have
An earlier version of this post described things the code doesn't do. To be explicit:
- There's no
singleflightgroup. Two simultaneous misses for the same cold slug both reach the origin. - There's no pub/sub subscription on the edge. When a link changes, api-core deletes the L2 key (the purger in
services/api-core/internal/linkmod/adapters.go). L1 isn't pushed to, so an edited link can be served from a node's memory for up to 60 seconds. - L1 is a TTL-bounded LRU, not an admission-controlled cache, and it's sized by entry count, not bytes.
- There's no
cache-statusendpoint, no per-tier response header and no latency histogram exported by the edge.
The 60-second window is why an editable link should use a temporary redirect, and why 301 vs 302 matters for the browser side of the same problem. The cache design is covered in more depth in cache strategy for URL redirects.
The one Prometheus metric we can point to in the edge code is elido_edge_redirect_total with fleet and outcome labels. The runbook mentions other metric names (edge_cache_*, edge_origin_grpc_duration) that we couldn't find registered in the current code, so we're not documenting them.
What stays off the hot path
Start with click storage. click.Producer.Emit serializes the event and hands it to a franz-go producer, and the handler calls it as go h.clicks.Emit(...). The produce callback only logs an error. If the event bus is slow, the visitor doesn't notice; the cost is that a click can be lost, which is the usual trade-off of fire-and-forget. Writing clicks into the analytics store is the job of click-ingester, which feeds the click analytics API.
Bot challenges stay off it as well: there's no JavaScript challenge on the redirect. Bot detection is a user-agent substring list that decides whether a click is counted, so crawlers and link-preview fetchers still get their redirect but don't inflate analytics. It's a coarse filter by design.
Scanning is asynchronous too. url-scanner publishes a verdict per link at creation time and on a schedule. The edge only reads the stored verdict (clean, suspect, blocked), and only blocked stops the redirect.
Rule evaluation is the one that looks risky and isn't. Smart links travel with the link record, so country, device and similar rules run against the cached copy, with the GeoIP lookup done in-process from a local database. A cache hit with rules doesn't need a network call to api-core.
Server settings are modest. cmd/server/main.go configures the server with a 2-second read and write timeout, a 30-second idle timeout and a 64 KB request body limit. We chose it over net/http for lower per-request allocation, as the service README notes. We haven't published a head-to-head benchmark for our handler, so that's a design reason, not a measured result.
How to measure it yourself
The repo has a load-testing runbook (docs/runbooks/19-load-testing.md) built on k6. Its pre-launch acceptance bar for the hot path is 1.5k req/s for 5 minutes at 15ms p95 with zero 5xx, and 5k req/s for 1 minute at 30ms p95 with under 0.1% 5xx. Those are thresholds, not results.
A test from a nearby load generator measures the service. A test from a far-away host measures your network. For visitor-side latency, probe from outside with a synthetic monitor, as in monitoring redirects with Sentry and Datadog.
Honestly, I wouldn't quote 15ms to a customer as a measurement yet. Gaps we'd close before printing a per-region table: a latency histogram on the edge, singleflight on cold misses, push invalidation of L1, and a committed benchmark behind the 15ms figure.
Marius Voß is DevRel and edge infra at Elido. Sources: services/edge-redirect, services/api-core/internal/linkmod/adapters.go and docs/runbooks/19-load-testing.md; no external vendor claims are made.
Related on the Blog
- Cache strategy for URL redirects - the L1 and L2 design in more depth.
- 301 vs 302 redirects - why editable links use a temporary redirect.
- Smart links explained - rules that run on the cached record.
- Monitoring link redirects with Sentry and Datadog - measuring from the outside.
- Link click analytics API - where the click events end up.
Frequently asked questions
Is 15ms p95 a measured number?
No. 15ms p95 (with p50 at 5ms) on a cache hit is the latency budget for the edge-redirect service, and it's what our alerts and load-test acceptance bar are written against. This post doesn't publish measured per-region percentiles because we have no committed benchmark or result file to cite for them.
How does an Elido redirect resolve a slug?
The edge looks in an in-process LRU first, then in a shared in-memory cache, and only then asks api-core over gRPC. Each cache layer is best-effort, so only the origin can return an authoritative not-found. A hit in a lower layer is copied up into the layers above it.
What stays off the redirect path?
Click storage, analytics and the url-scanner's checks. The edge emits the click event to the event bus in a separate goroutine and answers the visitor without waiting for it. Bot filtering is a user-agent check that decides whether a click is counted, not a challenge the visitor has to pass.
Why does Elido use 302 by default?
A 302 tells browsers not to treat the destination as permanent, so an edited link takes effect on the next visit. A link can be set to 301 or 307 individually. The trade-off is covered in our 301 vs 302 post.
Where are the edge POPs?
Production today is a single host running the edge service behind a reverse proxy. A multi-region edge (Europe, North America and Southeast Asia, each running the same edge binary) is planned, not live. The main databases and event bus stay in the EU, and in that design only redirect cache data would sit next to the edge nodes, as ADR-0014 describes.
Can an edited link be served stale?
Briefly. When a link changes, api-core deletes its shared-cache entry, but an edge node's in-process copy lives until its 60-second TTL runs out. So a destination edit can take up to a minute to reach every node, which is one reason temporary redirects suit editable links.
Try Elido
Paste a URL, get a working short link
No signup. Link lives for 30 days. Sign up to keep it forever.
No signup needed. Sign up free for 50 links a month.