Un clic su un link corto è una riga di dati: timestamp, slug del link, campagna, paese, dispositivo. A Looker Studio non importa da dove arrivi quella riga, solo che qualcosa gliene consegni una secondo una pianificazione. Ci sono tre modi onesti per farlo: un export CSV programmato verso un Google Sheet, una tabella di warehouse alimentata dall'API di analytics o da un export programmato, oppure un connettore community mantenuto da qualcun altro. (Google ha rinominato di nuovo lo strumento Data Studio nel 2026; questa guida usa Looker Studio, ancora il termine di ricerca più comune.)
Scegli una qualunque delle tre e prima o poi sbatti contro lo stesso muro: unire i clic sui link corti alle sessioni GA4 su una chiave condivisa. I due totali non coincideranno, e nessun design di dashboard chiude quel divario - clic contro sessioni GA4 spiega il perché, ed è utile leggerlo prima di mettere entrambi i numeri sullo stesso grafico.
Questo articolo copre le tre strade, la join key che fa funzionare il blend, un layout di dashboard che un marketing lead aprirà davvero ogni lunedì, e quanto costa ciascuna strada in termini di ritardo di aggiornamento. Se le basi del tracciamento dei link sono ancora poco chiare, come tracciare i clic sui link è il punto da cui partire per primo.
Tre modi per portare i dati sui clic in Looker Studio
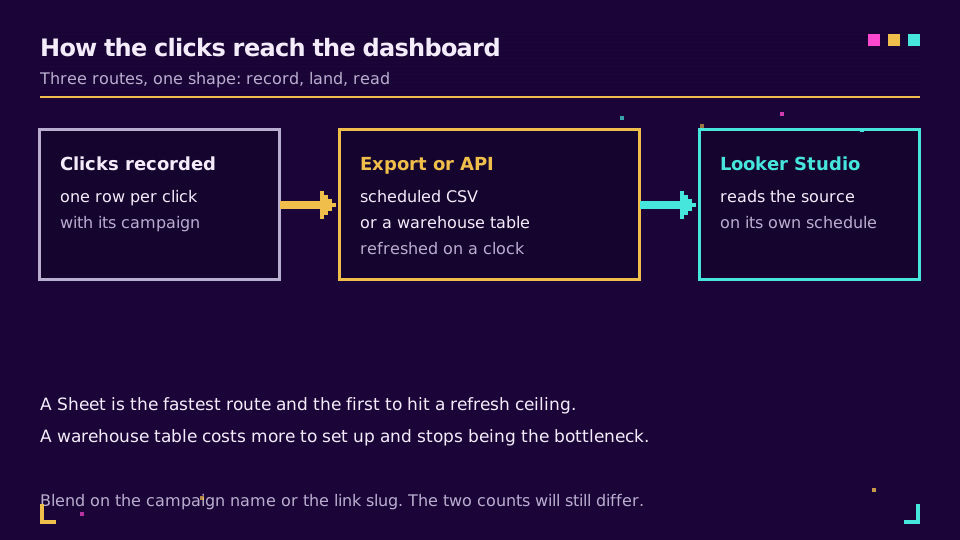
Looker Studio legge da un'origine dati; non parla direttamente con un servizio di redirect, e niente collega uno URL shortener direttamente ad esso fuori dalla scatola. Ogni configurazione funzionante si riduce allo stesso percorso a tre fasi: un clic viene registrato, un export o una chiamata API lo porta in qualcosa che Looker Studio può leggere, e Looker Studio legge quell'origine. La differenza tra le tre strade sta interamente nella fase intermedia - cosa preleva i dati, con quale frequenza, e chi lo mantiene.
L'export CSV programmato verso un foglio
La versione più semplice non richiede nient'altro da installare. Un report programmato esporta i clic - link, campagna, clic, visitatori unici, paese, dispositivo - come CSV con cadenza giornaliera o settimanale, depositandosi in una cartella o una casella di posta che controlli. Carica quel CSV in un Google Sheet, ricaricandolo a ogni esecuzione oppure scriptando l'importazione, e il foglio diventa l'origine dati di Looker Studio. Se già porti gli URL di campagna in un foglio per altri motivi, importare in blocco da Google Sheets descrive una struttura del foglio che evita che import ed export si ostacolino a vicenda.
Il compromesso è l'aggiornamento. Un'origine basata su Sheets preleva secondo la propria pianificazione, non nel momento in cui arrivano nuovi dati, e un caricamento manuale del CSV è aggiornato solo quanto l'ultimo export. Va bene per una revisione settimanale. Non va bene per il giorno del lancio.
La tabella di warehouse, alimentata dall'API o da un export programmato
La versione più duratura tratta l'API di analytics, oppure lo stesso export programmato puntato su uno storage cloud invece che su una casella di posta, come un feed verso una tabella di warehouse, e poi punta su di essa il connettore BigQuery nativo di Looker Studio. Serve più configurazione: qualcosa deve girare secondo una pianificazione per prelevare e caricare la tabella, e qualcuno deve possedere quel job. In cambio ottieni uno storico interrogabile e una tabella che può alimentare più di un report. La guida all'API di analytics include uno script per il prelievo giornaliero che puoi puntare a quella tabella.
Stai decidendo se quel loader debba interrogare l'API o farsi inviare i nuovi clic? Webhook contro polling per il tracciamento dei clic illustra entrambi i pattern e l'ibrido su cui atterrano la maggior parte dei team. L'API di analytics è la stessa interfaccia in entrambi i casi; export e API espongono gli stessi dati sui clic a intervalli diversi.
I connettori community, e l'avvertenza che li accompagna
Una manciata di connettori creati dalla community dichiara di portare i dati sui clic o sui link corti direttamente in Looker Studio, senza bisogno di CSV o warehouse. Possono far risparmiare tempo di configurazione, e alcuni sono mantenuti bene. L'avvertenza riguarda la proprietà: un connettore community esegue codice che non hai scritto tu e si aggiorna, o smette di aggiornarsi, secondo la pianificazione del suo autore. Verifica chi lo pubblica e quando ha rilasciato l'ultimo aggiornamento prima di puntarne uno verso dati di produzione. Un export CSV che controlli tu funzionerà ancora tra un anno. Un connettore community potrebbe non farlo.
Scegliere una join key: nome campagna o slug del link
Portare i dati sui clic in Looker Studio risolve metà del problema. L'altra metà è metterli in grafico rispetto a GA4 senza che il blend produca silenziosamente dati senza senso.
Il blend di Looker Studio richiede una dimensione condivisa, una join key, tra le due origini. Per i dati sui link corti uniti a GA4, valgono la pena due candidate:
- Nome campagna, abbinato al valore
utm_campaignche GA4 già riporta. La scelta più comune, perché è la dimensione che GA4 mostra di default. - Slug del link, se taggi con esso gli eventi GA4 o le landing page. La scelta più solida quando una campagna copre più link, perché resiste al fatto che qualcuno digiti il nome della campagna in modo leggermente diverso in un canale.
Qualunque altra cosa - data, paese, dispositivo - unisce le due tabelle senza mettere in relazione un clic con la sessione che ha causato, e il grafico sembrerà plausibile pur essendo sbagliato. Il nome campagna funziona solo se il valore è identico, carattere per carattere, tra export e GA4. Le convenzioni di naming UTM mantengono quel valore coerente in tutto un team, e la guida UTM end-to-end tratta la disciplina di tagging che rende affidabile una join key.
Perché i due numeri non coincideranno
Unisci correttamente le due origini e la dashboard mostrerà comunque due totali diversi per la stessa cosa: clic sui link e sessioni GA4 su una campagna, fianco a fianco, in disaccordo. Non è un bug. Un clic viene registrato al redirect; una sessione GA4 viene registrata da un tag del browser che scatta solo dopo che la pagina di destinazione si è caricata e il consenso lo permette. Il traffico bot, gli scanner di posta e le anteprime dei link gonfiano il lato dei clic; le decisioni sul consenso e l'abbandono della pagina sgonfiano il lato delle sessioni; una persona che clicca tre link in una email produce tre clic e una sessione, per progettazione. Clic sui link corti contro sessioni GA4 ripercorre tutto questo e offre un modo per riconciliare il divario invece di rincorrere una corrispondenza esatta che non esiste.
Una volta ho assistito a una riunione in cui un marketing lead e un sales ops lead hanno discusso per venti minuti su quale numero fosse "quello vero". Avevano ragione entrambi; stavano misurando cose diverse. Dillo prima che qualcuno lo chieda - uno stakeholder a cui non è mai stato detto darà per scontato che uno dei due numeri sia rotto.
Sistema il lato dei clic una volta per tutte, invece di riesportarlo ogni settimana. Le analytics dei link di Elido riportano già i clic filtrati dai bot per workspace, e lo stesso export programmato che alimenta la strada CSV o warehouse qui descritta mantiene aggiornata l'origine di Looker Studio senza che nessuno debba toccare un foglio di calcolo a mano.
Un layout di dashboard che un marketing lead legge davvero
La maggior parte delle dashboard di Looker Studio fallisce come falliscono la maggior parte dei fogli di calcolo: troppi tile, nessuna gerarchia, niente che dica a un marketing lead dove guardare per primo. Un layout aperto ogni settimana, invece che costruito una volta e ignorato, si attiene a quattro elementi.
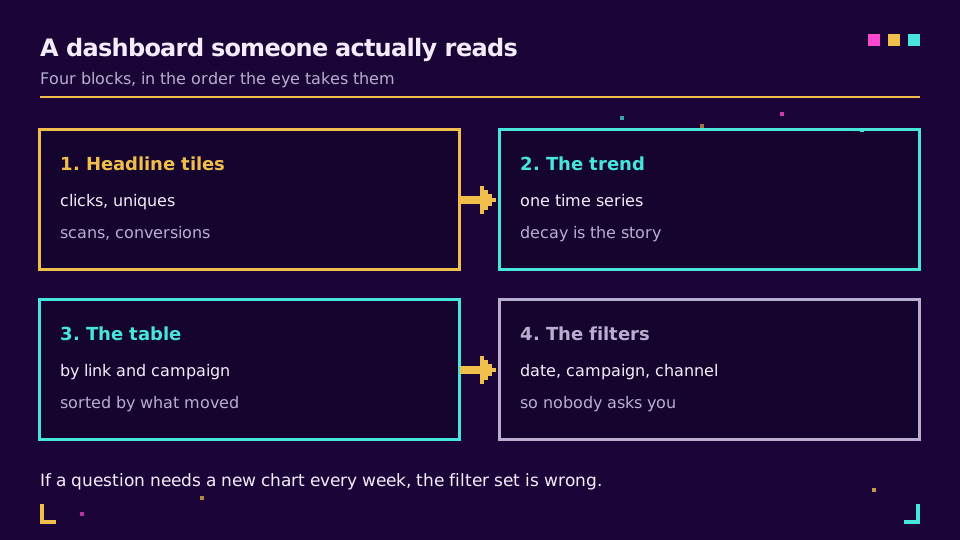
- Quattro tile principali, riga superiore: clic totali nel periodo, visitatori unici, click-through rate, e la variazione rispetto al periodo precedente sul primo tile. Tre sembrano incompleti non appena qualcuno chiede del trend; sei riportano la riga superiore a essere un muro di numeri.
- Una serie temporale, sotto i tile: clic al giorno nella finestra selezionata. È il grafico che le persone controllano per primo nonostante i tile si trovino sopra, quindi posizionala abbastanza in alto da evitare che qualcuno debba scorrere per vedere se le ultime due settimane sono in salita o in discesa.
- Una tabella, per link: slug del link, campagna, clic, visitatori unici, ordinata per clic decrescenti. È qui che un marketing lead trova il link che ha smosso il numero principale, invece di chiedere a qualcuno di andare a controllare. Cosa misurare nelle analytics dei link corti tratta quali colonne si guadagnano il proprio posto.
- Il set di filtri, trattato più avanti, che trasforma questo da un report che qualcuno ricostruisce ogni settimana in uno che le persone controllano da sole.
Il set di filtri che lo rende self-service
Una dashboard senza filtri riceve un solo utilizzo: il giorno in cui viene costruita. Una con i controlli giusti viene aperta da persone che non erano mai state nella stanza quando è stata progettata, il che è il vero senso di Looker Studio rispetto a un grafico statico in una presentazione.
Tre controlli coprono quasi ogni domanda che un marketing lead si pone da solo. Un selettore di intervallo di date, impostato di default sugli ultimi 30 giorni invece che su tutto il periodo. Un filtro per campagna o slug del link, corrispondente a qualunque join key tu abbia scelto, così chiunque può isolare una campagna senza dover ricostruire nulla. E un filtro per canale o tag, se il tuo schema di tagging raggruppa i link per canale, così email contro social contro a pagamento non richiede tre dashboard separate.
Resisti alla tentazione di un quarto. Ogni controllo in più è una decisione in più che chi guarda per la prima volta deve prendere prima di vedere un numero, e quattro selezioni prima che qualcosa venga renderizzato abitua le persone ad aspettare che sia qualcun altro a far girare il report.
Frequenze di aggiornamento e quanto costa ciascuna strada
Nessuna delle tre strade aggiorna Looker Studio in tempo reale, e aspettarselo è il modo più rapido per perdere fiducia nella dashboard la prima volta che qualcuno nota un ritardo.
Le origini Google Sheets si aggiornano secondo una pianificazione che scegli tu - ogni 15 minuti, ogni ora, ogni quattro ore o ogni 12 ore - con 15 minuti come intervallo sia predefinito sia più rapido disponibile. Una tabella di warehouse dietro il connettore nativo è più flessibile: da ogni 1 a ogni 50 minuti, oppure ogni ora fino a ogni 12 ore, che è il valore predefinito. I connettori dei prodotti marketing di Google stessi, Analytics incluso, sono fissi a ogni 12 ore senza possibilità di override. La documentazione di Google sulla gestione della freschezza dei dati copre la ripartizione completa, oltre al cooldown di un minuto sui refresh manuali.
Il costo segue più o meno la stessa forma. La strada Sheets non costa nulla oltre all'export programmato che hai già. La strada warehouse aggiunge qualunque cosa il tuo livello di storage e query addebiti per il volume caricato - trascurabile per la maggior parte dei workspace, da tenere d'occhio se carichi righe grezze per singolo clic invece di un rollup giornaliero. I connettori community sono tipicamente gratuiti da installare, ed è esattamente per questo che l'avvertenza sulla manutenzione conta: nessun rapporto di fatturazione vincola il connettore a un livello di servizio, solo la scelta di chi lo ha costruito di continuare a rilasciare aggiornamenti.
Correlati sul blog
- Clic sui link corti contro sessioni GA4
- Analytics dei link corti: cosa misurare e cosa ignorare
- Come tracciare i clic sui link senza tirare a indovinare
- Convenzione di naming UTM: regole per dati di campagna puliti
- Importa in blocco link corti da un Google Sheet
- API di analytics per i link: preleva le statistiche sui clic con una chiave API
Domande frequenti
È possibile costruire una dashboard di analisi dei link in Looker Studio?
Sì, e non serve un connettore diretto da uno URL shortener a Looker Studio per farlo. Le tre strade che funzionano sono un export CSV programmato verso un Google Sheet, una tabella di warehouse alimentata dall'API di analytics o dallo stesso export programmato, e un connettore creato dalla community. Ciascuna raggiunge Looker Studio tramite il proprio tipo di origine dati, e nessuna richiede codice personalizzato oltre a collegare l'export.
Looker Studio è lo stesso prodotto di Data Studio?
Sì, sono lo stesso prodotto sotto due nomi. Google ha rinominato Data Studio in Looker Studio nel 2022, poi lo ha rinominato di nuovo Data Studio nel 2026; i connettori, il blending e il comportamento di refresh non sono cambiati insieme al nome, quindi un tutorial scritto sotto l'uno o l'altro nome resta valido.
Con quale frequenza Looker Studio aggiorna i dati da un Google Sheet?
Fino a ogni 15 minuti, che è anche l'intervallo più rapido disponibile per un'origine basata su Sheets. In alternativa puoi impostarlo su ogni ora, ogni quattro ore o ogni 12 ore, e un refresh manuale è disponibile in qualsiasi momento, con un limite di una volta al minuto.
Posso unire i clic sui link corti con le sessioni GA4 in Looker Studio?
Sì, usando un blend su una join key condivisa: il nome campagna abbinato al valore utm_campaign di GA4, oppure lo slug del link se tagghi gli eventi GA4 con esso. Il blend viene eseguito anche senza una chiave corrispondente, ma il grafico risultante non significherà nulla, e anche con una chiave corretta i due totali continueranno comunque a non coincidere, perché un clic e una sessione misurano eventi diversi.
Serve un data warehouse per portare i dati sui clic in Looker Studio?
No. Un export CSV programmato verso un Google Sheet funziona come origine dati di Looker Studio senza alcun warehouse nel mezzo, ed è la strada più semplice verso una dashboard funzionante. Una tabella di warehouse giustifica la configurazione extra quando ti serve più storico di quanto un foglio possa contenere comodamente, oppure più di un report che legge gli stessi dati.
I connettori community di Looker Studio sono sicuri da usare per i dati sui clic?
Possono esserlo, ma comportano un rischio di manutenzione che un connettore nativo non ha. Un connettore community esegue codice di un autore terzo, richiede accesso a qualunque cosa a cui si connette, e si aggiorna secondo la pianificazione di quell'autore e non la tua, quindi verifica chi lo pubblica e da quanto tempo prima di puntarne uno verso dati di clic in produzione.
Prova Elido
Incolla un URL, ottieni un link breve
Senza registrazione. Il link vive 30 giorni. Iscriviti per conservarlo.
Gratis, nessuna registrazione richiesta · 2 al giorno