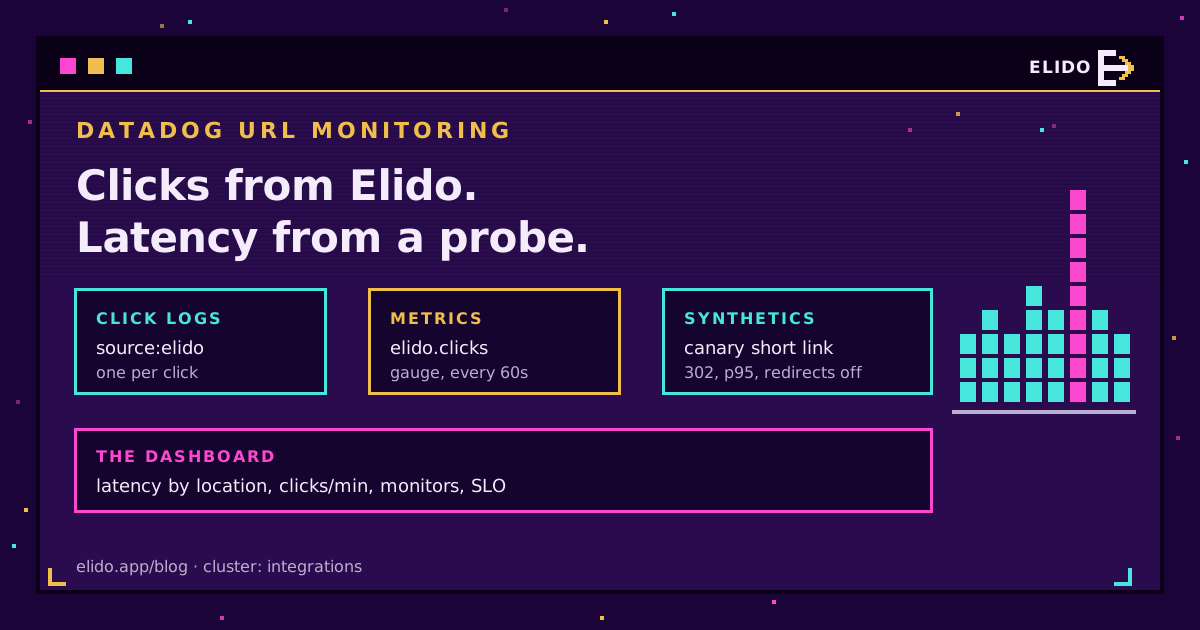
Datadog URL monitoring for Elido short links comes from two sources. Elido itself sends click data: one log per click to the Datadog Logs intake, plus three click-count metrics flushed every 60 seconds. It doesn't send redirect latency or status codes. For those you point a Datadog Synthetics HTTP test at a canary short link, and the redirect latency dashboard, the monitors and the SLO all sit on top of that pair.
That split is the whole design. The click side tells you how many people went through your links and from where, and the synthetic side tells you whether the redirect answered, how fast, and with the right status. This post covers the exact metric and log shapes, how to connect them, what to put on the dashboard, and where it stops.
If latency is why you're here, read how the p95 under 15ms budget works first. It explains what a healthy number looks like before you pick a threshold.
What Elido Actually Sends to Datadog
Every click in a connected workspace takes two paths. The log path posts a single-entry batch to https://http-intake.logs.<site>/api/v2/logs, straight after the click is recorded. The metrics path bumps an in-memory counter, and a flusher posts the counts to https://api.<site>/api/v2/series once a minute. Both authenticate with the DD-API-KEY header.
| Signal | Name in Datadog | Cadence | Tags and fields |
|---|---|---|---|
| Click log | source:elido, message starts link_click | One per click | workspace_id, link_id, slug, country, device, destination, ip, timestamp |
| Click count | elido.clicks | Every 60s | workspace_id, vendor:elido |
| Clicks by country | elido.clicks_by_country | Every 60s | above plus country |
| Clicks by device | elido.clicks_by_device | Every 60s | above plus device |
The metrics are gauges, and the value is the number of clicks counted since the previous flush. So a point of 37 means 37 clicks in roughly the last minute. That's the natural unit for an ops chart, and it means you sum over time for totals rather than applying as_count(). Note what's missing: there is no link_id or slug tag on the metrics. I'd call that a sensible call on cost, because Datadog bills custom metrics per unique tag combination, and a slug tag on a busy workspace would multiply the series count by the number of links.
The log fields arrive nested under an attributes object, so in Log Explorer the facets look like @attributes.slug and @attributes.country. Expand one log before building anything. Ten seconds, and it saves a broken query.
Connecting Datadog in Your Elido Workspace
Setup is two fields. You need a Datadog API key (not an application key) and the site your organization runs on.
- In Datadog, open Organization Settings, then API Keys, and create one named something like
elido-forwarder. - Check your site. The Datadog site guide maps each login URL to its site;
app.datadoghq.eumeans you enterdatadoghq.eu,us5.datadoghq.commeans you enter exactly that. - In Elido, open Integrations, pick Datadog, paste the key, type the site and save. The key is encrypted at rest.
- Wait up to five minutes, because the forwarder caches workspace integration settings, then click one of your own links from a phone and search
source:elidoin Log Explorer.
Leave the site blank and Elido assumes datadoghq.com. For an EU organization, that's the classic silent failure. A typo does the same. Every POST fails, and nobody sees the error.
The Test connection button sends one test log (marked elido_test: true) to your Datadog site and shows Datadog's answer, so a wrong key or site fails right there with Datadog's 403. A pass proves the key works, not that your pipelines and indexes keep the logs, so the real proof is still a click log showing up. Same rule as for the Mixpanel click forwarder: real click, or it didn't happen.
Building a Redirect Latency Dashboard That Measures the Hop
Since Elido doesn't send timings, the latency data has to come from something that makes requests. A Datadog Synthetics HTTP test is the right tool, and it measures what the visitor feels, DNS and TLS included.
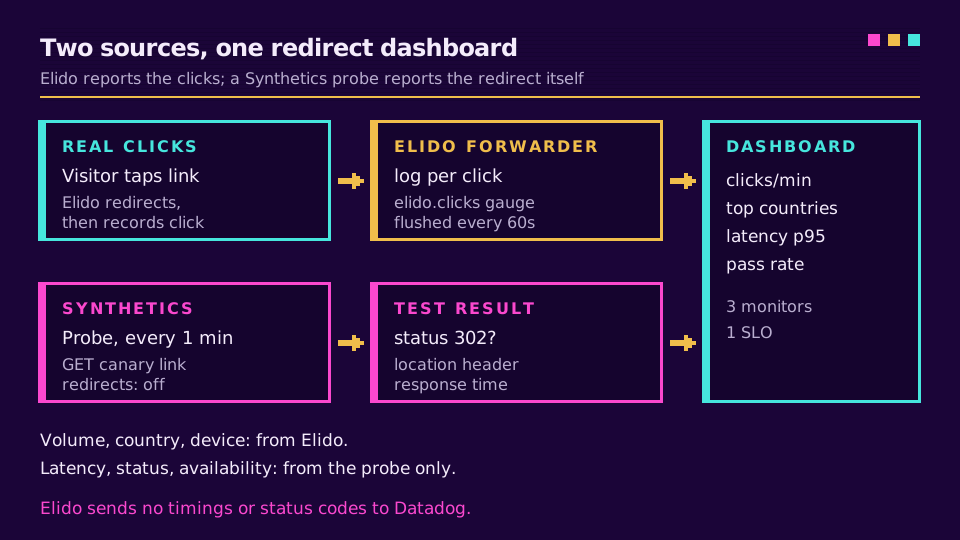
Here's the test I set up on every workspace:
- URL: a dedicated canary link, ideally on your own custom domain, pointing somewhere boring and stable.
- Follow redirects: off. With it on, you're timing your landing page, and a slow hero image will page you at 3am for a redirect that was fine.
- Assertions: status code is 302 (the default; use 301 or 307 if that's what you set, and 301 vs 302 explains the trade-off), the
locationheader contains your destination, and response time below a threshold. - Locations: at least three, with one in the EU region your audience is in. Run every minute.
- Header: a
User-Agentcontainingbot, so Elido treats the probe as a bot and skips the click event.
Pick the threshold from what you observe for a week, not from a blog post. Synthetic timings include the probe's own network path, so a probe on another continent will never match an in-region number, and that's fine. What you want is a line that stays flat.
The dashboard then needs four widgets. Response time by location, as a timeseries of the synthetic test. Assertion pass rate. Clicks per minute from elido.clicks. And a top list of countries.
# Clicks per minute across the workspace (gaps become zeros)
default_zero(sum:elido.clicks{workspace_id:42})

# Hourly click totals
sum:elido.clicks{workspace_id:42}.rollup(sum, 3600)

# Top 10 countries over the dashboard window
top(sum:elido.clicks_by_country{workspace_id:42} by {country}, 10, 'sum', 'desc')
Why default_zero? Because a minute with no clicks produces no point at all, and without the interpolation function Datadog draws a straight line across the gap. That line lies.
Monitors for Click Drops and Broken Short Links
Three monitors cover most of what goes wrong with links, and each uses a different source, which is where the split from the first section pays off.
Redirect broken or slow. The synthetic test already is a monitor. Alert when two or more locations fail in the same run, so one flaky probe region doesn't wake anyone. Any answer other than your 302 fails the status assertion, so a deleted, expired or paused canary link shows up here as a 404 or a 410.
Traffic stopped. Create a metric monitor on sum:elido.clicks{workspace_id:42} and turn on the notification for missing data after, say, 30 minutes. Since Elido sends nothing in a quiet minute, "no data" here really means "no clicks", which is the event you care about during a campaign.
Traffic odd. An anomaly monitor on the same metric, with the direction set to below, catches a campaign that normally does 4,000 clicks an hour and suddenly does 200. I've seen that pattern three times, and each time the cause sat outside the link: a disapproved ad, a newsletter that went to the wrong segment, a QR poster behind scaffolding. Give it a couple of weeks of history before trusting its bands.
Want per-link alerting? The metrics can't do it, but the logs can. Create a log-based metric from source:elido grouped by @attributes.slug, and you get a per-slug click count you can monitor. Keep it to a filtered set of campaign slugs, or the cardinality cost comes back through the side door.
An SLO You Can Actually Defend
A service level objective on a short link only means something if its source measures the redirect. Build it on the synthetic test. A monitor-based SLO with that single test as its monitor does the job.
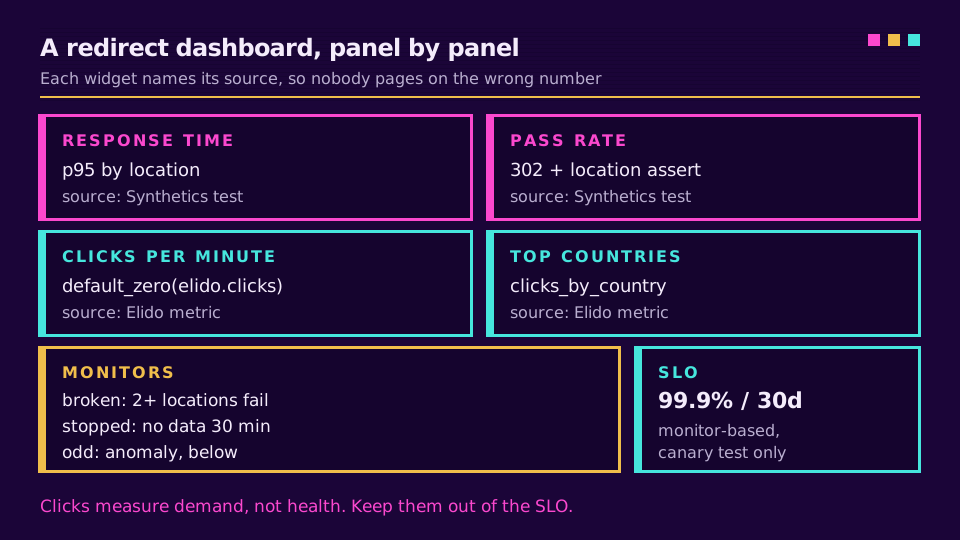
I'd start at 99.9% over 30 days. That's about 43 minutes of failed checks a month, and it's a budget you can explain to a marketing lead in one sentence. Don't build it on click volume. Clicks measure demand, not health; a link nobody clicks is perfectly available.
If a flat line on that SLO widget is what you've been missing, set up a workspace, point the canary at your own domain, and run it for a week before you set the target.
Self-Hosted Elido: Scraping the Redirect Counters
On a self-hosted install you get one more source. The redirect service exposes a Prometheus endpoint at /metrics, and the Datadog Agent's OpenMetrics check can scrape it. The useful series is elido_edge_redirect_total, a counter with fleet and outcome labels, where the outcomes include ok, notfound, expired, paused and error.
That gives you what the SaaS integration doesn't: a real 404 rate across all traffic, computed as notfound over the total. A second counter, edge_redirect_clicks_filtered_bot_total, shows how many redirects were served to bots without a click event. There's no latency histogram on that endpoint, though. Latency still comes from Synthetics, self-hosted or not. The k3s self-hosting playbook covers where that endpoint sits in the deployment.
Where the Datadog Integration Stops
Now the limits, most likely to bite first.
Delivery is best effort. A failed log POST gets one retry after a second and is then dropped. A failed metrics flush isn't retried at all; that minute is gone, and the next window starts clean. Treat elido.clicks as a trend line and reconcile totals against Elido's own click analytics, which is the record of truth.
The logs carry the visitor IP and the full destination URL, UTM tags included. If your Datadog org is in the US, that's personal data leaving the EU, and the EU data residency guide for marketing teams walks through how to weigh it. At minimum, pick the EU site if you have one.
Log cost scales with clicks, one ingested log each. A viral link makes a viral bill. Exclusion filters, or a log-based metric paired with a short retention index, keep it sane.
And the scope is clicks. No link-created events, no conversions, no latency, no status codes. Honestly, I'm not sure a click forwarder should carry latency at all; the probe that measures from outside is the more truthful witness anyway.
Read the cornerstone → Hitting p95 under 15ms for redirects
Related on the Blog
- Mixpanel link tracking - the same click forwarder, pointed at product analytics.
- Cache strategy for URL redirects - why redirect latency looks the way it does.
- Link rot prevention strategy - what to do after the 404 monitor fires.
- Short-link clicks vs GA4 sessions - why your click counts and analytics sessions disagree.
- GA4 server-side tracking via redirects - server-side click events, sent to Google instead.
- Klaviyo link tracking - the same click forwarder, sending each click into Klaviyo.
Întrebări frecvente
Can I monitor short links in Datadog?
Yes, from two directions. Elido forwards every click to Datadog as a log and sends per-minute click counts as metrics, which covers traffic volume. For availability and latency you add a Datadog Synthetics HTTP test against a canary short link, which measures the redirect from outside the way a visitor experiences it.
What metrics does Elido send to Datadog?
Three gauge metrics, flushed once a minute per workspace: elido.clicks with the click count for the window, elido.clicks_by_country with a country tag, and elido.clicks_by_device with a device tag. All carry workspace_id and vendor:elido tags. Alongside them, each click is sent as a log with source elido.
Does Elido send redirect latency to Datadog?
No. The integration sends clicks, not timings, and there is no latency or status-code metric in the payload. Build the redirect latency dashboard from a Datadog Synthetics HTTP test instead, with redirect following switched off, so the response time you chart is the redirect hop alone rather than your landing page.
Which Datadog site should an EU workspace use?
Use the site your Datadog organization lives on, typed as the bare domain, for example datadoghq.eu for the EU site. If you leave the field empty, Elido falls back to datadoghq.com, the US site, and an EU organization will not see anything that lands there.
Why does my Elido click metric show no data instead of zero?
Elido only sends a point for a minute in which the workspace had at least one click. A quiet minute produces no point at all, so Datadog shows a gap. Wrap the query in default_zero() on dashboards, and use a no-data alert when you want to catch traffic stopping completely.
Do Datadog synthetic checks count as clicks in Elido?
They can. Elido skips the click event for user agents that match its bot list, such as ones containing the word bot or common HTTP libraries. Set a custom User-Agent header on the synthetic test that includes bot, and point the test at a dedicated canary link, so probes never inflate campaign numbers.
Încearcă Elido
Lipește un URL, obții un link scurt funcțional
Fără înregistrare. Linkul este activ timp de 30 de zile. Înregistrează-te ca să-l păstrezi pentru totdeauna.
Gratuit, fără înregistrare · 2 pe zi