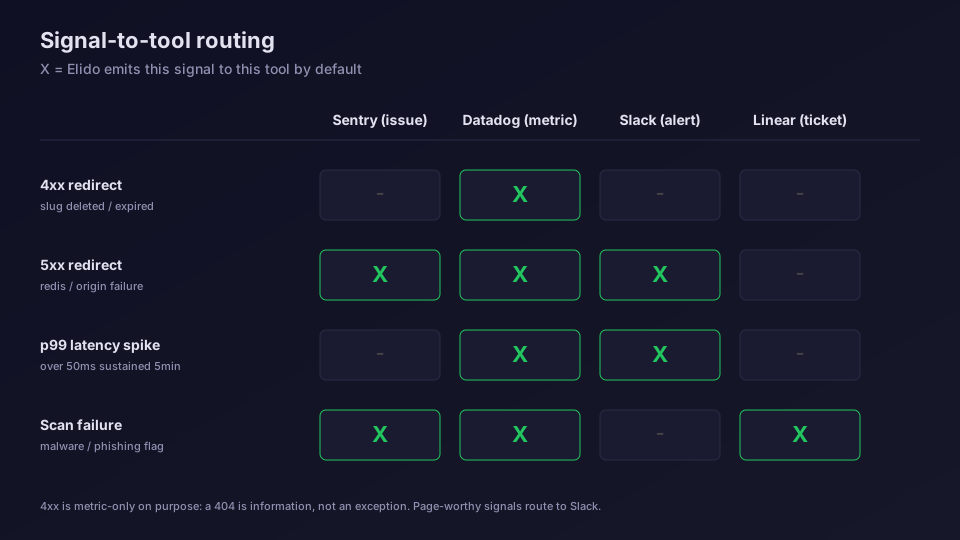
Short link monitoring splits cleanly between the two tools. Sentry is where Elido sends link health events: a destination that stopped answering, a link that expired, a click cap that was hit, a custom domain that failed verification. Datadog is where Elido sends clicks, one log per visit and three click-count metrics per minute. Redirect latency goes to neither, because Elido doesn't export it; you measure it from outside with a synthetic probe.
This post is the Sentry-first half of that picture, plus a plain answer to "which tool for what". If you're here for Datadog dashboards, the Datadog redirect metrics guide covers the click metrics, the log shape and a Synthetics-based latency board in depth, so I won't repeat it.
One piece of context before the wiring. A redirect can be perfectly healthy while the link is dead: the short URL answers in a few milliseconds and sends people to a 404. That's why URL monitoring for short links needs a destination-aware signal and a speed signal, and why no single tool gives you both from one feed. The p95 under 15ms breakdown explains what "healthy" looks like on the speed side.
What Short Link Monitoring Has to Catch
I sort failures into three buckets, because each one needs a different tool.
The link broke. Its destination returns a 4xx or 5xx, times out, or the domain stopped resolving. Your redirect still works, but it now forwards people into an error page. Elido finds these with a daily destination check and raises link.broken.
The link stopped by design. It hit its expiry date or its click cap, so Elido stopped redirecting it. Nothing is wrong technically, yet if a campaign still points at it, someone needs to know. That's link.expired and link.cap_reached. A custom domain that never verified raises domain.ssl_failed, which belongs in the same pile.
The redirect itself got slow or went down. That's the speed signal, and it's the one Elido doesn't emit as a metric. You watch it from outside.
Traffic is a fourth signal, but a softer one. A campaign that usually does thousands of clicks an hour and suddenly does a few dozen usually means something upstream changed, like a paused ad or a peeled-off QR sticker. Click counts live in Datadog, so that's where the drop monitor goes.
What Elido Sends to Sentry
Sentry is one of the outbound channel types in Elido's notification system, next to Discord, Telegram and plain signed webhooks. It rides the same delivery pipeline as webhooks, with one difference: instead of the raw Elido event, it posts a small Sentry event.
Each delivery is one JSON event sent to your project's store endpoint, which Elido derives from the DSN. Given https://[email protected]/8, the target is https://o4711.ingest.sentry.io/api/8/store/ and the public key goes into the X-Sentry-Auth header. There's no Sentry SDK anywhere in the path, and because the DSN host is parsed rather than hard-coded, a self-hosted Sentry-compatible server works the same way. The payload follows Sentry's event payload format:
{
  "event_id": "9f0c4e1b2a7d4c33b8e5d6a1f2c3b4a5",
  "timestamp": 1790000000,
  "level": "error",
  "logger": "elido",
  "platform": "other",
  "message": "<humanized event name, e.g. Link / Broken>",
  "environment": "production",
  "tags": { "event_type": "link.broken", "workspace_id": "42" }
}
The level is picked from the event name. Anything that means "this link doesn't work right now" arrives as error: .broken, .expired, cap_reached, ssl_failed. Deletes and downgrades arrive as warning, everything else as info.
Now the honest part about tags. Every event carries event_type and workspace_id tags, and the environment and release fields are filled when you set them on the channel. A cap-reached event also carries a clicks tag. The broken-link event, though, doesn't carry the slug or destination as tags today, so the Sentry issue tells you that a link in workspace 42 broke, and you open the links list in Elido, where the broken one carries a flag. I'd rather tell you that now than have you hunt for a slug tag at 2am.
Setting Up a Sentry Channel for Broken Link Alerts
Setup takes a couple of minutes and the DSN is the only credential. The Sentry channel is marked Beta because you create the Sentry project yourself; a one-click install through Sentry's integration platform is on the roadmap but not built, so today it's paste-a-DSN.
- In Sentry, create a project, pick the Other platform, and copy the DSN from the next screen. The DSN explainer shows which part is the key and which is the project ID.
- In the Elido dashboard, open Notifications, add a channel, choose Sentry, paste the DSN and, optionally, an environment name such as
production. - Keep the default events or pick your own. The defaults are
link.broken,link.expired,link.cap_reachedanddomain.ssl_failed.
Elido checks the DSN when you save: it must be http or https, include a public key, and end in a project ID. A malformed one is rejected right there instead of failing silently later.
If you manage config as code, the same channel is one API call. Channels are webhook endpoints with a kind:
curl -X POST https://api.elido.app/v1/workspaces/42/webhooks \
  -H "Authorization: Bearer elido_live_xxx" \
  -H "Content-Type: application/json" \
  -d '{
    "kind": "sentry",
    "url": "https://[email protected]/8",
    "events": ["link.broken", "link.expired", "link.cap_reached", "domain.ssl_failed"],
    "description": "Link health to Sentry",
    "config": { "environment": "production", "release": "spring-campaign" }
  }'
Sentry deliveries aren't HMAC-signed, since Sentry authenticates the request by its key instead. They do get the normal retry policy: three attempts in total, with the retries five and fifteen minutes after a failure, then the delivery is marked failed. You can list them at /v1/workspaces/{workspace_id}/webhooks/{id}/deliveries and retry one by hand.
There's no test button for this channel. The cleanest test I know: create a throwaway link with an expiry a minute or two away and wait. Elido scans for newly expired links every five minutes, so an error-level issue should land in Sentry shortly after.
Once link health events land in Sentry, the next question is what you'll do with them, and that depends on how Sentry groups them. If you're still choosing a plan, compare what each tier includes before you wire the channel.
How Sentry Groups Elido Link Health Events
These events have no stack trace and no exception, so Sentry's fallback grouping groups them by message. In practice that means one issue per event type: all broken-link events become one issue whose event count climbs, all expiries another.
That's useful for paging and less useful for triage. Two tweaks help:
- Set the environment on the channel. With separate channels per workspace or per environment (
production,campaigns), each gets its own filter in the issue stream, and you can scope alert rules to one. - Add a fingerprint rule in the Sentry project settings on
tags.workspace_idif you route several workspaces into one project and want an issue per workspace.
For alerting, build on Sentry's own issue alert rules: "a new issue is created" catches the first broken link, and "the issue is seen more than N times in an hour" catches a batch, say a whole campaign whose landing domain went down. Keep in mind the detection pace behind it. The destination check runs once a day, the first failure fires straight away, and a link that stays broken fires again after 24 hours. Sentry is the right inbox for this. It isn't a five-minute outage detector, and I wouldn't pretend otherwise.
Where Datadog Fits in Redirect Monitoring
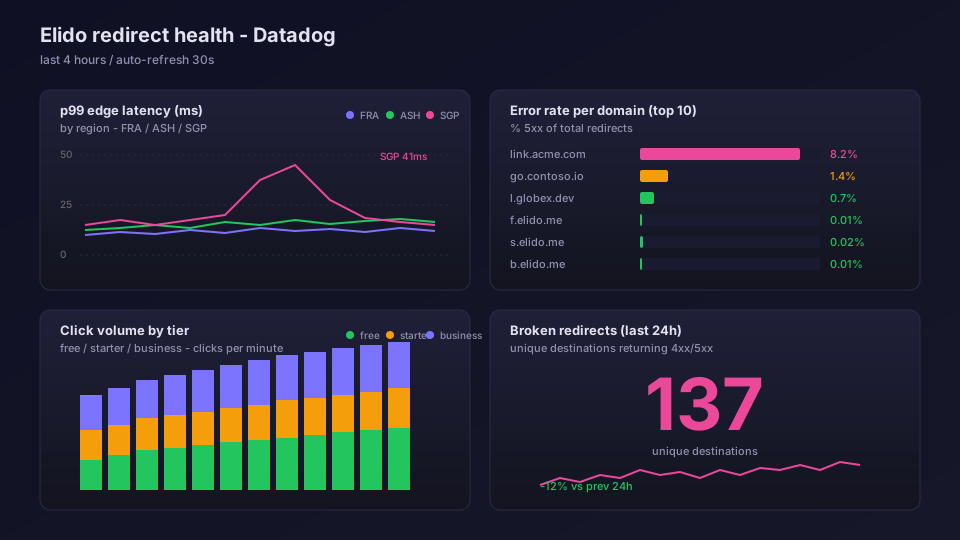
Datadog gets clicks, not link health. Every click becomes one log sent to the Logs intake for your Datadog site, with source elido, tags workspace_id, vendor:elido and link_id, and the click fields under attributes. Once a minute, Elido also sends three gauges per workspace: elido.clicks, elido.clicks_by_country and elido.clicks_by_device.
What's not there matters as much. No latency metric, no status codes, no domain, tier or region tags. A failed log POST gets one retry and is then dropped. Settings are cached for up to five minutes, so a newly saved key takes a moment to kick in, and the dashboard's Test connection button sends one test log and shows Datadog's answer, which catches a wrong key or site but not a pipeline that drops the logs, so a real click is still the proof that it works.
So Datadog's job here is traffic: click volume per minute, top countries, and a monitor for "clicks dropped to near zero". The Datadog URL monitoring guide has the queries, the setup steps and the integration page lists the fields. Reconcile totals against Elido's click analytics, which stays the record of truth.
Watching Redirect Latency From Outside
For the speed signal, point a synthetic check at a canary short link: a link you create only for monitoring, so probes never mix with campaign numbers. Datadog's HTTP tests do this well, and any uptime service that can skip redirects works too.
Three settings decide whether the number means anything:
- Turn off redirect following. You want the time until the 301 or 302 comes back, not the time your landing page takes to render.
- Assert on the status code and the
Locationheader, so a redirect to the wrong place fails the check. - Send a User-Agent containing
bot. Elido skips click events for known bot agents, so your probe won't pad click counts.
Run the probe from locations near your audience. A cache-hit redirect in-region should sit well under the 15ms p95 budget, and a sustained jump is worth a page. A check against your custom domain also tells you its TLS certificate still works, which a click forwarder never could.
Which Tool for What
Here's the split I'd set up for a team running paid campaigns on short links:
| Signal | Where it comes from | Where to watch it | Alert style |
|---|---|---|---|
Destination broken (link.broken) | Elido daily destination check | Sentry issue | New issue, notify owner |
| Link expired or capped | Elido link events | Sentry issue | New issue, low urgency |
Custom domain failed (domain.ssl_failed) | Elido domain verification | Sentry issue | New issue, notify admin |
| Click volume and drops | Elido click forwarder | Datadog metrics | No-data or drop monitor |
| Redirect latency and status | Your synthetic probe | Datadog Synthetics or similar | Page on sustained failure |
A small team can start with the Sentry channel alone; it covers the failures that silently waste ad spend. Add Datadog once someone actually looks at traffic dashboards, and add the probe on the day a slow redirect would cost you money. If Sentry isn't your team's inbox, the same link health events go to Discord or Telegram, and a broken link can also open a Linear ticket.
Read the cornerstone → Hitting p95 under 15ms for redirects
Related on the Blog
- Datadog URL monitoring for short links - click metrics, logs and a Synthetics latency board.
- Link rot prevention strategy - what to do after a broken-link issue lands.
- Discord and Telegram alerts for short links - the same link health events in a chat channel.
- Linear tickets from link alerts - turning a broken link into a tracked task.
Veelgestelde vragen
What is short link monitoring?
Short link monitoring means watching two things: whether each link still leads somewhere useful, and whether the redirect itself answers fast. Elido covers the first with link health events (broken destination, expired link, click cap reached, failed custom domain). The second you measure from outside with a synthetic check against a canary link.
Should short link alerts go to Sentry or Datadog?
Link health events go to Sentry, because Elido only sends them there (plus Discord, Telegram and plain webhooks). Datadog receives click logs and three per-minute click metrics, which suits traffic dashboards and click-drop monitors. Neither tool gets redirect latency from Elido; that comes from a probe you run.
How do I connect Elido to Sentry?
Create a Sentry project with the Other platform, copy its DSN, then in the Elido dashboard open Notifications, add a channel, choose Sentry and paste the DSN. You can set an environment name. Elido parses the DSN and posts events to the project's store endpoint with an X-Sentry-Auth header; no SDK is involved.
Which Elido events show up in Sentry?
By default a Sentry channel subscribes to link.broken, link.expired, link.cap_reached and domain.ssl_failed, and all four arrive at level error. You can subscribe to other events such as link.created, which arrive as info. There is no click event, so individual visits never reach Sentry.
Does Elido send redirect latency to Datadog?
No. The Datadog integration sends one log per click plus elido.clicks, elido.clicks_by_country and elido.clicks_by_device every 60 seconds. There is no latency or status-code metric. Measure redirect time with a Datadog Synthetics HTTP test against a canary short link, with redirect following switched off.
How fast does Elido detect a broken destination?
Destinations are checked once a day with a HEAD request (GET when a server rejects HEAD), following up to three redirects with a five-second timeout. The first failure fires link.broken, and a link that stays broken fires it again after 24 hours. For faster detection on a key link, add your own synthetic check.
Probeer Elido
Plak een URL, krijg een werkende korte link
Geen aanmelding nodig. Link blijft 30 dagen actief. Meld je aan om hem voor altijd te bewaren.
Gratis, geen aanmelding nodig · 2 per dag